An official website of the United States government
Here's how you know
Official websites use .gov
A
.gov website belongs to an official
government organization in the United States.
Secure .gov websites use HTTPS
A lock (
) or https:// means you've safely
connected to the .gov website. Share sensitive
information only on official, secure websites.

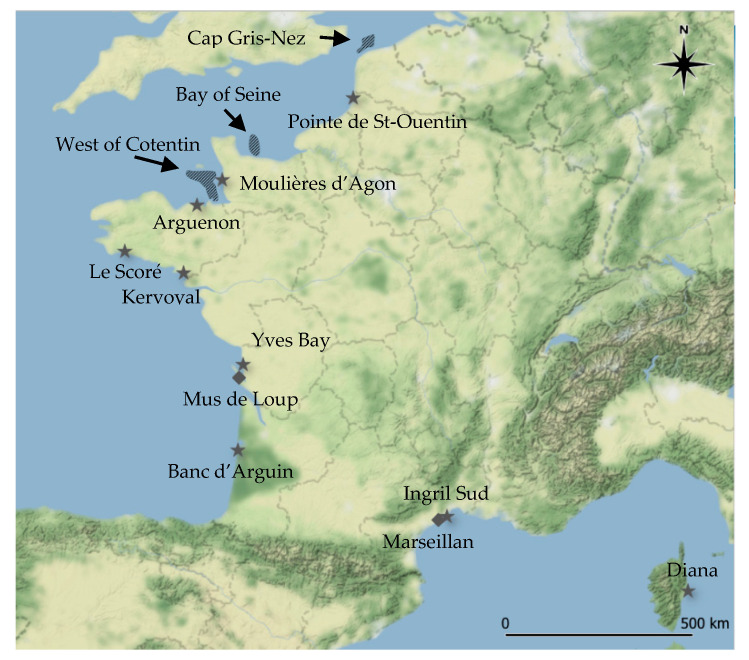
 : mussels;
  : oysters) and gastropod beds (
 : whelks). Map generated using QGIS software (version 3.8.3) and map tiles by Stamen Design, under CC BY 3.0. Data by OpenStreetMap, under ODbL.