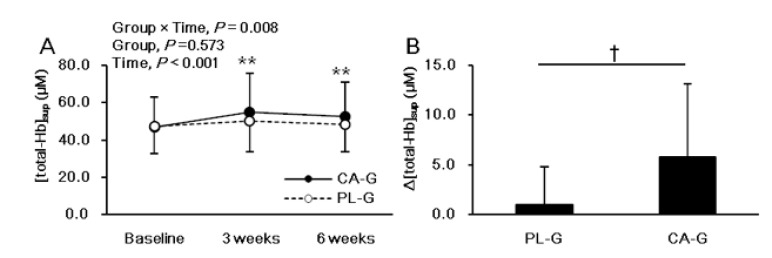
Figure 2.
Mean (± SD) [total-Hb]sup, which is an indicator of brown adipose tissue vascular density in the supraclavicular region, at baseline and at 3 and 6 weeks after ingestion of capsinoid (●) and placebo (○) in all participants (n = 38) (A). Mean (± SD) changes in [total-Hb]sup after the 6-week intervention in all participants (n = 38) (B). There were significant intervention interactions (group × time, p = 0.008) and main effect on the time (p < 0.001), but no main effect on the group (p = 0.573) by using ANOVA. The post hoc comparison between baseline and 3 or 6 weeks showed a significant increase in the [total-Hb]sup (p < 0.001 for 3 weeks and p < 0.001 for 6 weeks, respectively) only in the CA-G (A; ** p < 0.01). A Welch test was conducted and it indicated that there was significant difference between the CA-G and PL-G (B; † p < 0.05). CA-G, capsinoid group; PL-G, placebo group; [total-Hb]sup, total hemoglobin concentration in the supraclavicular region.

