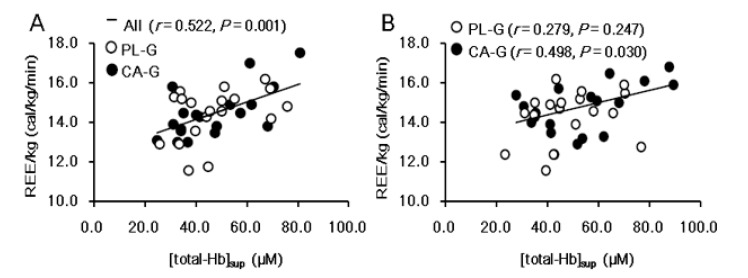
Figure 4.
There were significant correlations between [total-Hb]sup and REE/kg in all participants pre-supplementation (A) and only in the CA-G in post-supplementation (B). Pearson’s correlation coefficient is denoted by r. CA-G, capsinoid group; PL-G, placebo group; REE/kg, resting energy expenditure per kg; [total-Hb]sup, total hemoglobin concentration in the supraclavicular region.

