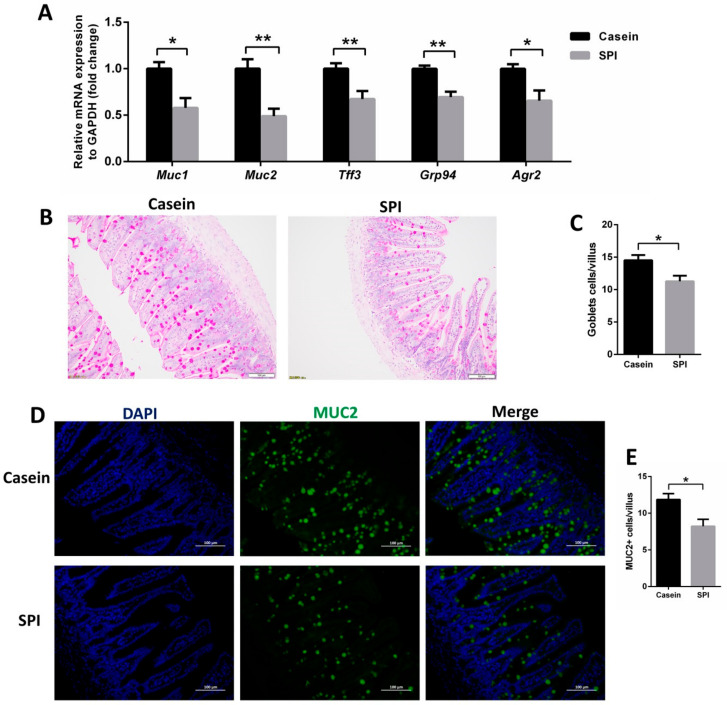
Figure 4.
Effect of SPI on mucin production in mouse ileum tissue. (A) qRT-PCR analysis of Muc1, Muc2, Tff3, Grp94, and Agr2 mRNA expression levels in mouse ileum tissue (normalized against Actb (β-actin); n = 8). (B,C) Representative PAS-stained histomicrographs and corresponding quantification of goblets cell per villus in the ileum tissue (n = 6). (D,E) Representative micrographs for MUC2 staining and corresponding quantification of MUC2+ goblet cells per villus in the ileum tissue (n = 6). All data are presented as means ± SEM. * p < 0.05; ** p < 0.01. Statistical significance was calculated using t-tests.

