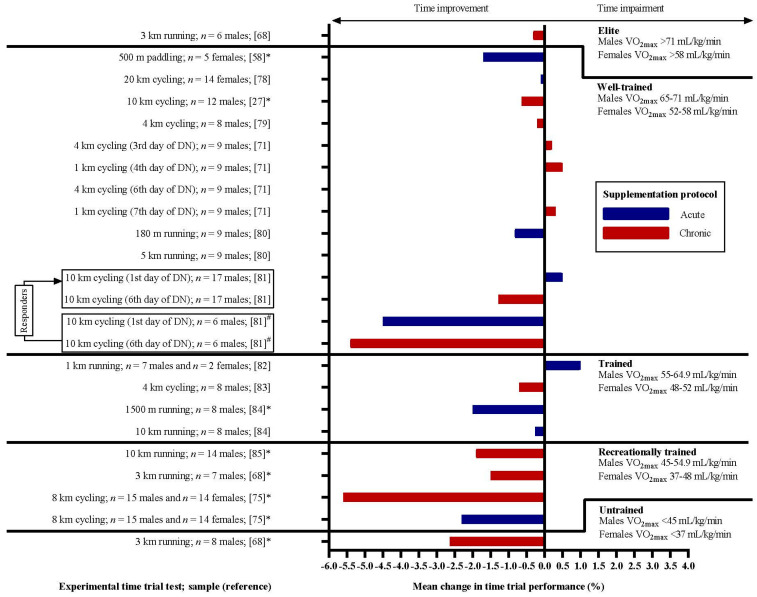
Figure 2.
Effects of DN supplementation on TT performance in athletes with different training statuses according to their VO2max. The graph presents the mean percentual changes in time-to-completion of given tasks in the experimental groups. Negative values represent improvement, as the task was finished in less time (bars to the left from y-axis) following acute (blue bars) or chronic (red bars) supplementation. Cited studies are listed in References [27,58,68,71,75,78,79,80,81,82,83,84,85]. * Statistically significant improvement in performance following DN supplementation; # improvement was observed in 6 of 17 participants dividing the group of well-trained athletes into “responders” and “non-responders”. The two experimental situations are, therefore, divided into four according to the specific reaction to DN supplementation of the participants [81].

