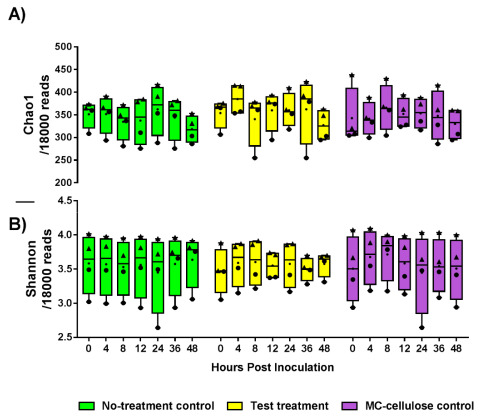
Figure 2.

Chao1 estimates (A) and Shannon indices (B) of the identified microbiota from bioreactors with a no-treatment control, test treatment and microcrystalline cellulose control at different times post-treatment (n = four biological replicates each; triangles are for donor 1 samples and circles for donor 2 samples). Results were calculated from rarefied 18,000 reads per sample. Middle lines represent mean. Data were analyzed using the Kruskal-Wallis test and Two-stage Benjamini, Krieger, and Yekutieli FDR procedure (p > 0.05).
