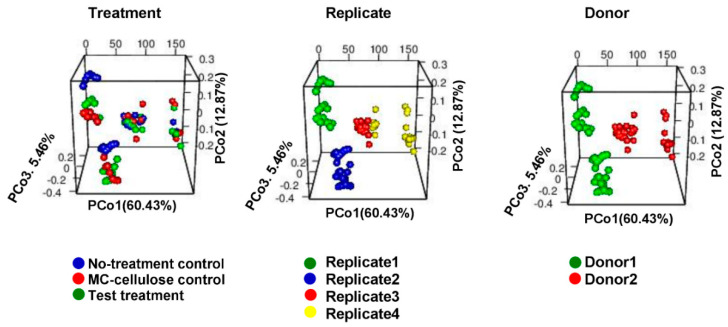
Figure 3.
Plots of Principal Coordinate Analysis (PCoA) based on Bray-Curtis distances among the identified microbiota in different samples, showing clustering based on the type of treatment, replicate and donor. The samples were colored as indicated in legends. PCoA1, PCoA2 and PCoA3 represent the top three coordinates that captured the highest microbial variability among samples, and the percentage shown indicates the fraction of variation represented by each coordinate. Adonis analysis was used to test for the statistical significance of sample grouping.

