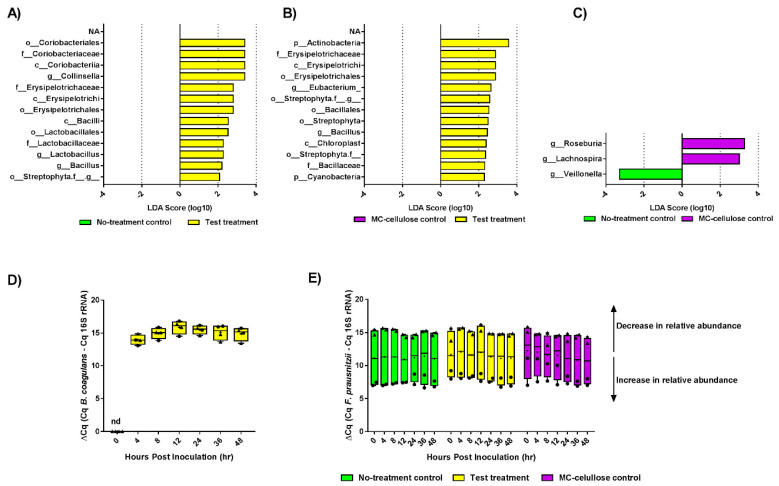
Figure 4.
The test formulation modulates gut microbiota composition. (A–C) Histograms of the linear discriminant analysis (LDA) scores showing microbial taxa that vary significantly in abundance between: (A) no-treatment control and test treatment, (B) microcrystalline cellulose control and test treatment, (C) no-treatment control and microcrystalline cellulose treatment. (C,D) Relative abundance charts for target species: (D) relative abundance of inoculated probiotic, B. coagulans, over 48 h with test treatment; (E) relative abundance of F. prausnitzii over 48 h with no-treatment control, microcrystalline cellulose control treatment and test treatment. Triangle symbols indicate donor 1 samples and circles for donor 2 samples.

