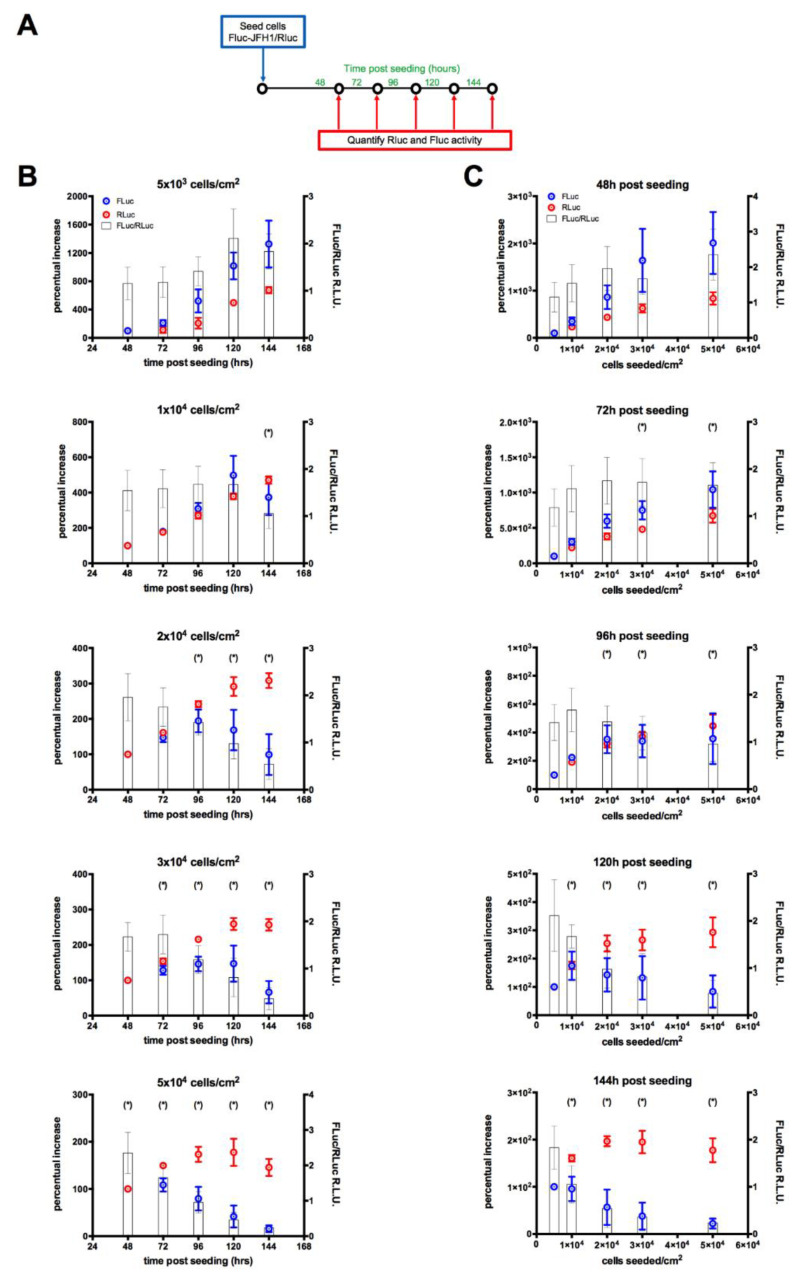
Figure 3.
Quantification of cell number and viral replication of a HCV double reporter subgenomic replicon cell line. (A). Different amounts of FLuc-JFH1/RLuc cells were seeded in 24-well plates and incubated for the indicated time points before being lysed and processed for luminometric detection of RLuc and FLuc signals, allowing to calculate the relative HCV replication as reported by the FLuc/RLuc ratio. (B) FLuc (blue circles) and RLuc (red circles) were expressed as the percentage of the signals obtained for the indicated different times post-seeding and number of cell seeded, relative to 48 h post-seeding, whereas the FLuc/RLuc ratios relative to each condition are shown as white bars. (C). FLuc (blue circles) and RLuc (red circles) were expressed as the percentage of the signals obtained at the indicated time point post-seeding and number of cell seeded, relative to 5 × 10³ cells cm2/seeded, whereas the FLuc/RLuc ratios relative to each condition are shown as white bars. Data are mean ± standard error of the mean relative to data repeated in three independent experiments. * = cells overconfluent.

