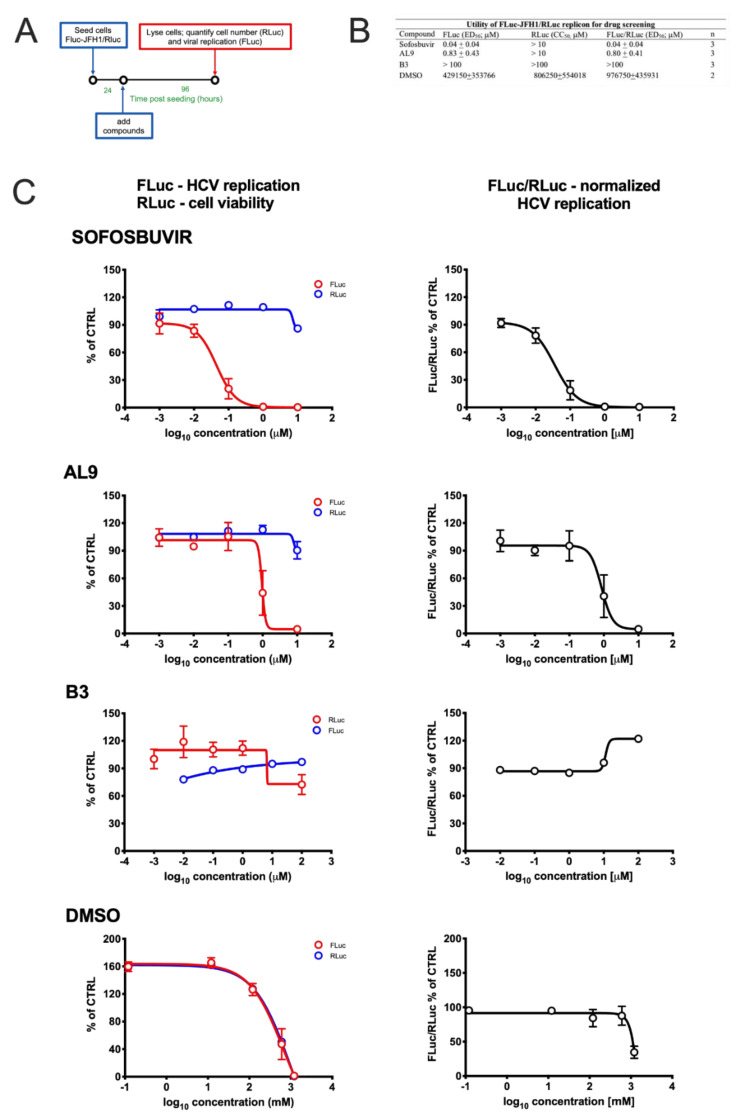
Figure 4.
Effect of different compounds on HCV replication and cell viability. (A) FLuc-JFH1/RLuc cells were seeded in 24-well plates (2.5 × 10⁴ cells/cm2); 24 h later, cells were treated with increasing concentrations of the indicated compounds; 72 h post-treatment, cells were lysed and processed for luciferase assays for the quantification of viral RNA replication (FLuc) and cell number/viability (RLuc), as described in the Materials and Methods section. (B) Curves such as those shown in (C) were analysed as described in the Materials and Methods section in order to calculate the effective dose 50 (ED50; FLuc), cell culture 50 (CC50; RLuc) and normalized ED50 (FLuc/RLuc), relative to the indicated compounds. Data shown are the mean + standard deviation of the mean relative to the indicated number of independent experiments (n). (C) The FLuc (left panels, blue lines) and RLuc (left panels, red lines) activities, as well as the FLuc/RLuc ratio (right panels) relative to each condition were expressed as a percentage of the vehicle treated cells and representative curves relative to the indicated treatments are shown.

