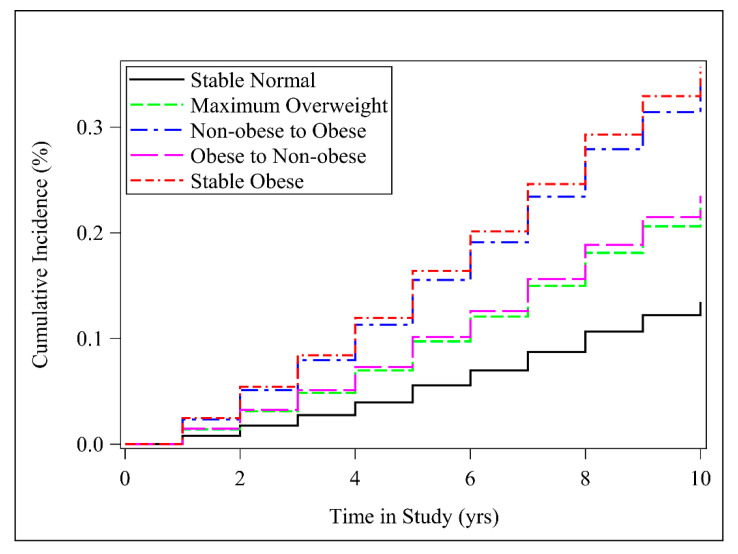
Figure 1.
Cumulative incidence curve for hypertension by weight change category. Multivariable Cox regression model adjusted for sex, baseline age, race/ethnicity, family income, education, and smoking status. Stable normal (BMI < 25.0 at both timepoints), maximum overweight (BMI 25.0–29.9 at either timepoint but not ≥30.0 at the other timepoint), non-obese to obese (BMI < 30.0 at younger age and ≥30.0 later), obese to non-obese (BMI ≥ 30.0 at younger age and <30.0 later), and stable obese (BMI ≥ 30.0 at both timepoints).

