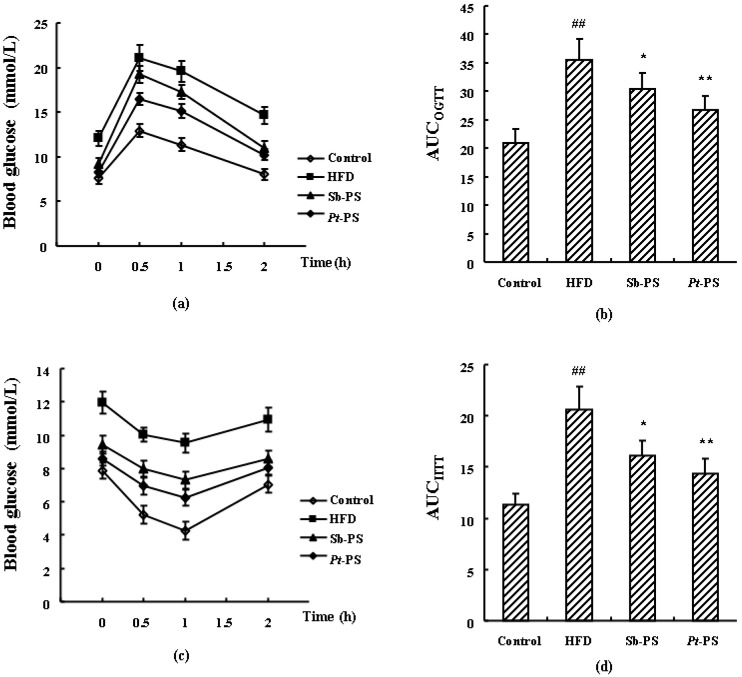
Figure 1.
Effects of Pt-PS determined in the oral glucose tolerance test (OGTT) and intraperitoneal insulin tolerance test (IITT) in HFD-fed mice (n = 7). (a) Blood glucose level at indicated time points measured in the OGTT; (b) AUCOGTT; (c) blood glucose level at indicated time points measured in the IITT; (d) AUCIITT. Data are expressed as mean ± SD. ## p < 0.01 vs. control mice; * p < 0.05, ** p < 0.01 vs. HFD mice.

