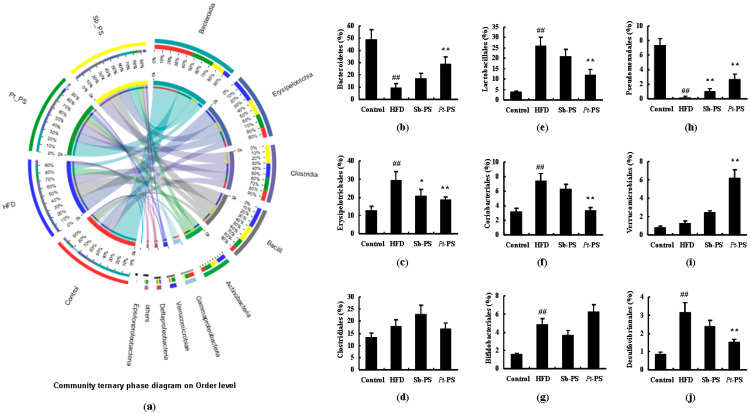
Figure 5.
Effects of Pt-PS on the gut microbiota at the order level using a community ternary phase diagram (n = 5). (a) Percent of community abundance at the order level; (b) Bacteroidetes at the order level in different groups; (c) Drysipelotrichales at the order level in different groups; (d) Clostridiales at the order level in different groups; (e) Lactobacillales at the order level in different groups; (f) Coriobacteriales at the order level in different groups; (g) Bifidobacteriales at the order level in different groups; (h) Pseudomonadales at the order level in different groups; (i) Verrucomicrobiales at the order level in different groups; (j) Desulfovibrionales t the order level in different groups. ## p < 0.01 vs. control; * p < 0.05, ** p < 0.01 vs. HFD.

