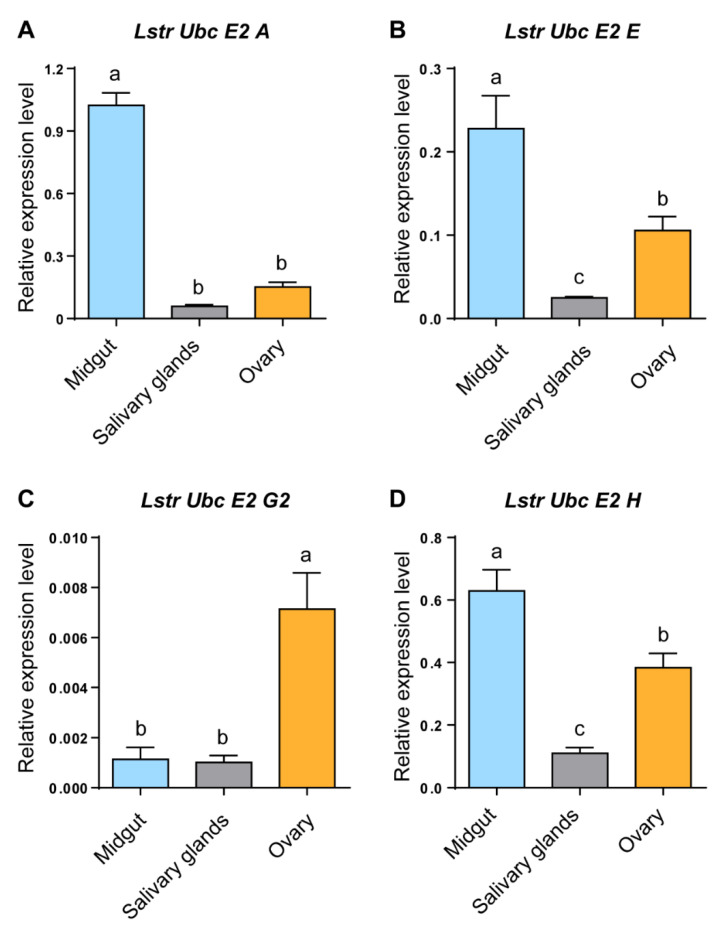
Figure 3.
The expression of LstrE2 A/E/G2/H in different tissues of small brown planthopper adults. RT-qPCR analysis of (A) LstrE2 A, (B) LstrE2 E, (C) LstrE2 G2, and (D) LstrE2 H expression in midguts, salivary glands, and ovaries of adults. In total, 50 midguts, 100 salivary glands, and 50 ovaries were considered to be a single replicate, and each treatment contained three replicates. All expressions are relative to first column in panel A. Bars labeled with different letters indicate significant differences in expression levels using RT-qPCR (p < 0.05).

