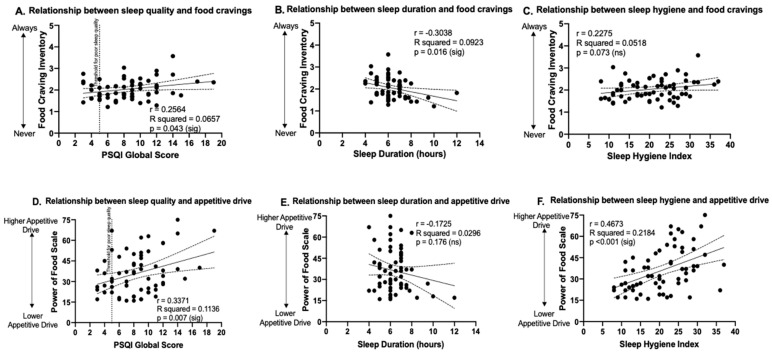
Figure 1.
The relationship between sleep measures and food cravings and appetitive drive. Relationships of sleep measures to Food Craving Inventory scores are shown in the top panels (A–C) and relationships of sleep measures to Power of Food Scale scores are shown in the bottom panels (D–F). Vertical dotted line in (A) and (D) indicates threshold for clinically significant poor sleep quality (PSQI global score >5). Dashed lines above and below the fitted regression lines indicate the 95% confidence interval. Statistically significant p-values (p < 0.05) are denoted as (sig) and non-significant results (p ≥ 0.05) denoted as (ns). PSQI: Pittsburgh Sleep Quality Index.

