Figure 2.
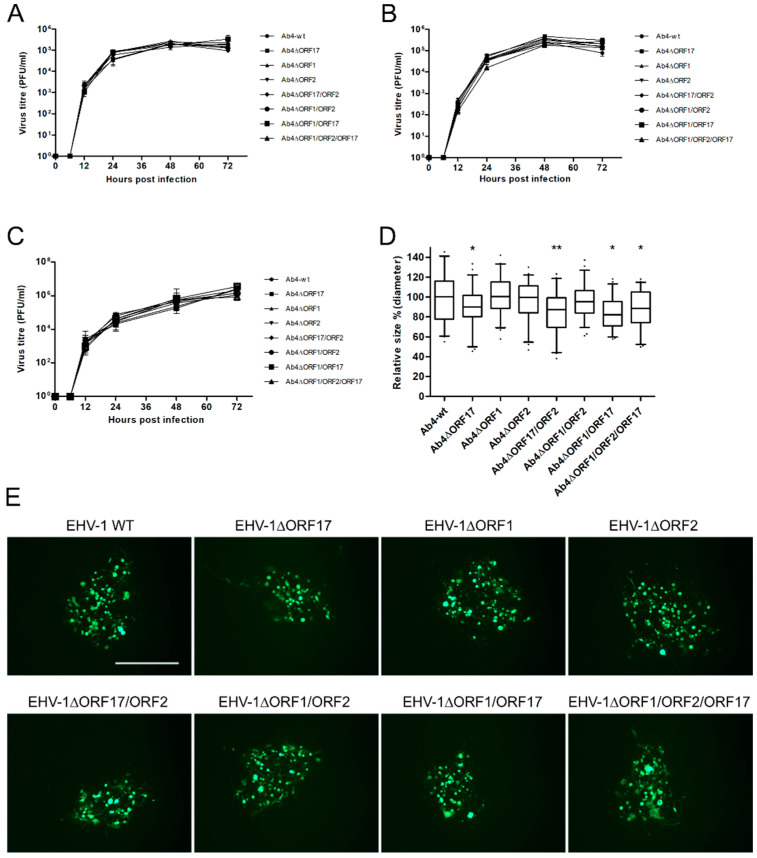
Characterization of mutant viruses. Growth kinetics of mutant Ab4 viruses on ED cells infected at an MOI of 0.1. (A) Infected cells and (B) supernatant were collected, and virus titers were determined at different time points. (C) For EC cells, both cells and supernatants were collected together at each time point and the virus titer was determined. Mean virus titers ± standard deviation are given. (D) Mean diameters of 150 plaques were measured for each virus. The plaque diameter of Ab4-wt was set to 100% and the mean diameter ± standard deviation is given; (n = 3; One-way ANOVA test followed by multiple comparisons test). *—p < 0.05, **—p < 0.01. (E) Representative images of plaques induced by the virus mutants on ED cells. Scale bar = 500 µm.

