Figure 3.
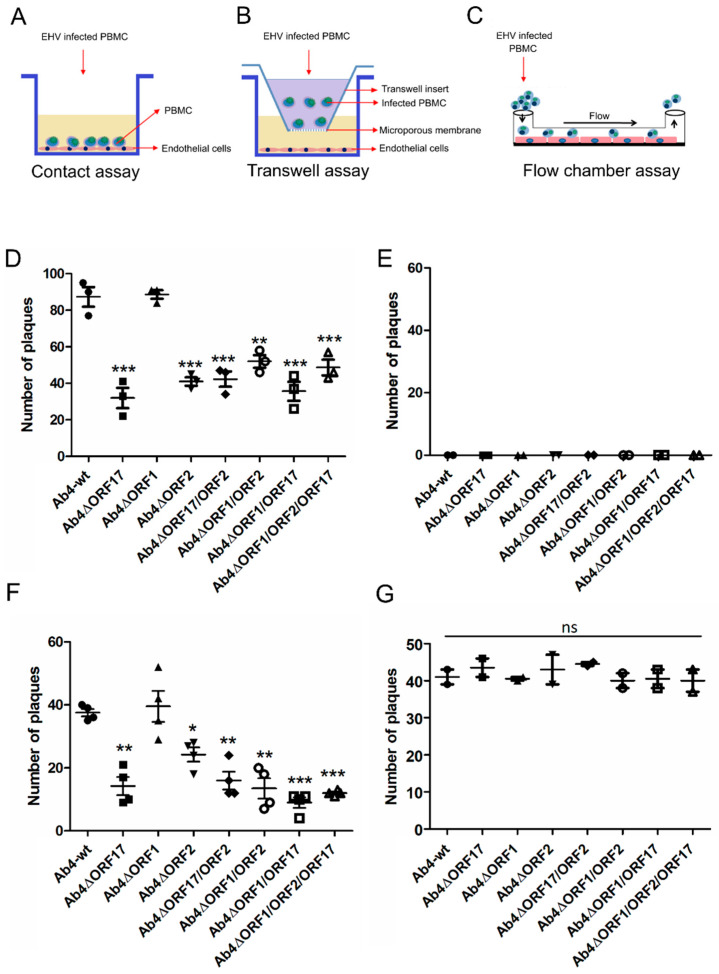
Virus transfer from EHV-1-infected PBMC to EC under static and dynamic flow conditions. Schematic diagram of (A) the contact assay, (B) the transwell assay, and (C) the flow chamber assay. PBMC were infected with Ab4-wt or mutant viruses at an MOI of 0.1 for 24 h. (D) The contact assay was performed after sorting of infected cells. Virus plaques were counted after 24 h. (E) As a control, infected PBMC were placed into a transwell insert without direct contact between PBMC and EC. The flow chamber assay was performed for the mutant (F) and corresponding revertant (G) viruses. Data are presented as mean plaque numbers ± SD; (n = 3; One-way ANOVA test followed by multiple comparisons test). *—p < 0.05, **—p < 0.01, ***—p < 0.001. ns—not significant.

