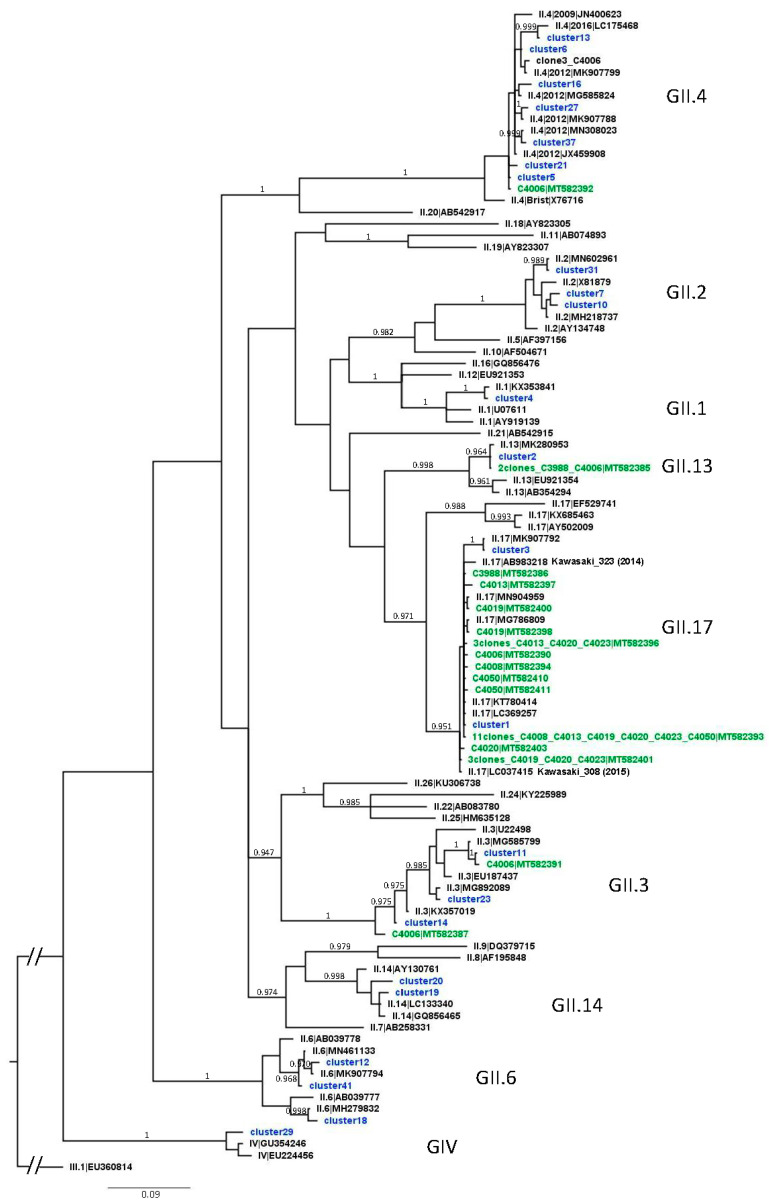
Figure 3.
Phylogenetic tree of VP1 clones and clusters from shellfish samples. Bayesian phylogenetic analysis was used to generate this tree with NoV GII, GIII, and GIV sequences retrieved from GenBank (black, with genotype|accession number), sequences of clones (green, with sample name|accession number), and of clusters (blue) obtained from the shellfish samples. Posterior probabilities above 0.95 are indicated just above or below the supported branch. The GIII.1 sequence was used as outgroup to root the tree.

