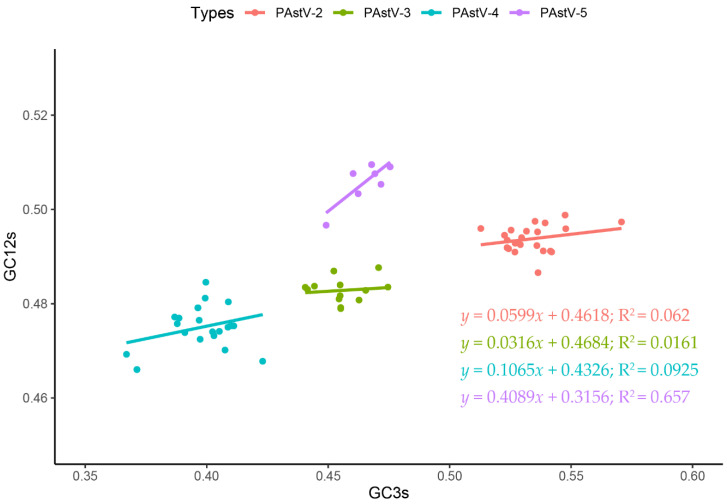
Figure 6.
Neutrality analysis of the PAstV complete coding genomes. The neutrality plot displays the correlation between GC content at synonymous positions (GC12s) and GC content at non-synonymous positions (GC3s). PAstV-2, PAstV-3, PAstV-4, and PAstV-5 strains are represented in orange, green, blue, and purple, respectively.

