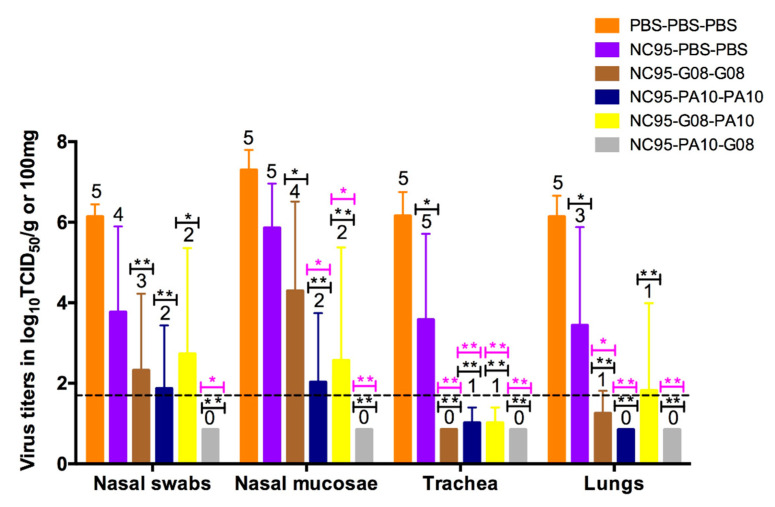
Figure 2.
Virus titers in nasal swabs, nasal mucosa, trachea, and lungs, 3 days after challenge with 107 TCID50 of MO15. The bars represent mean virus titers ± SD. The dotted line indicates the detection limit. Each color of the bar represents a different vaccine group as shown by the legend at the top right corner. The numbers above the bars indicate the number of pigs with detectable virus titers. Significant reductions of virus titers as compared with the naïve challenge control group (PBS-PBS-PBS, black asterisks) and infection-immune challenge control group (NC95-PBS-PBS, pink asterisks) in ANOVA are shown above the bars. * p < 0.05, ** p < 0.01.

