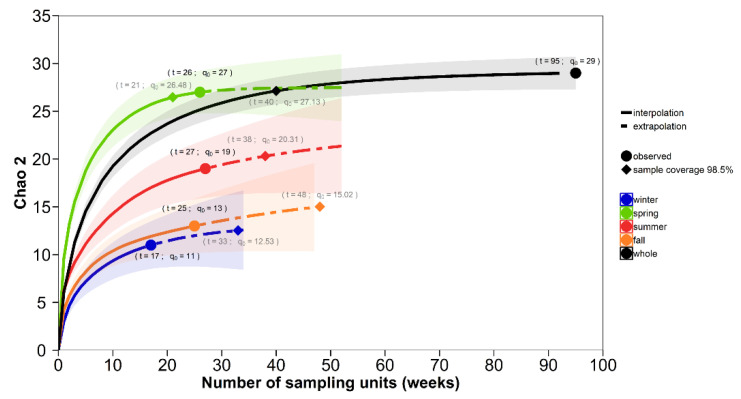
Figure 4.
Seasonality pattern in Culicoides community structure: richness profile is trigged during spring. Sampled size-based rarefaction and extrapolation plot of Culicoides are shown to depict the seasonality richness pattern. Species accumulation curves (Chao2, q0) across the sampling weeks in each season (colors) are drawn. The solid line describes rarefaction or interpolated curve. The dashed line represents the accumulation profile up to double the reference sample size (extrapolation curve). The 95% confidence interval is the shaded area, and significance between profiles was the inference of their nonoverlapping. Observed q0 and the reference or complete sample size (t) are indicated with round dots and values detailed with bold legends. Diamonds, dots and grey legends show q0 and t necessary to attain 98.5% of the expected richness after coverage-based rarefaction and extrapolation analysis.

