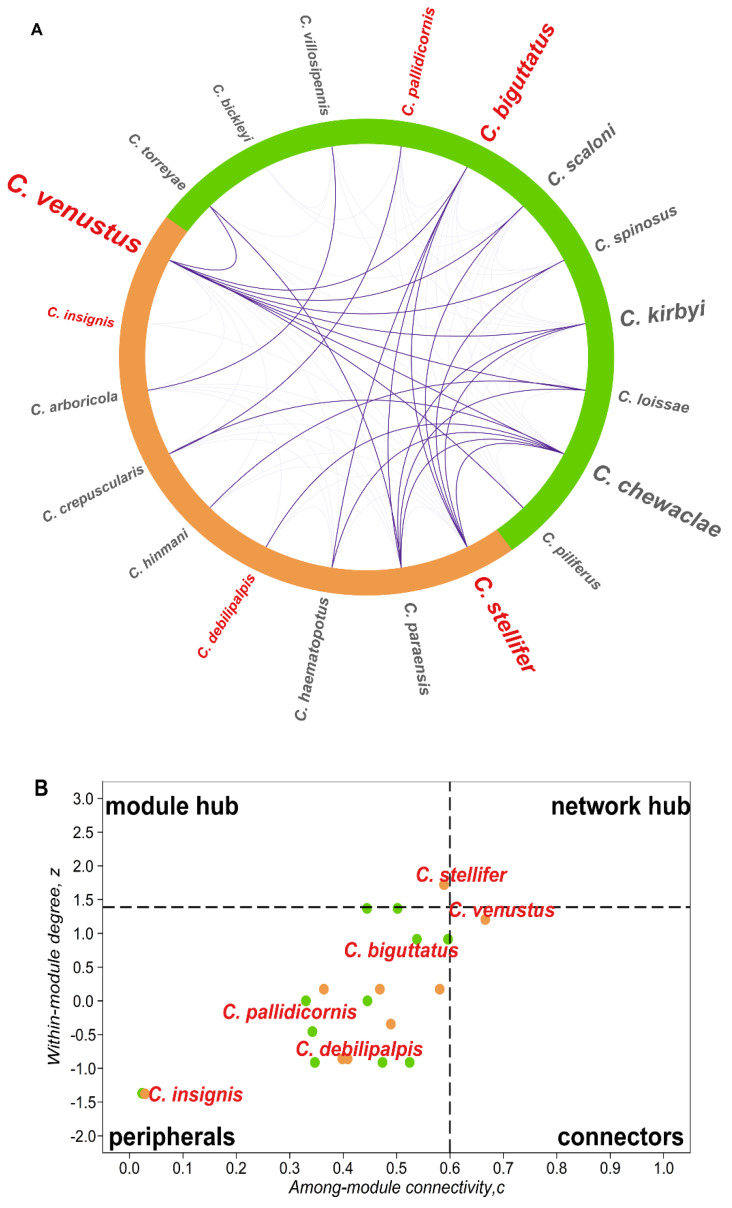
Figure 6.
Co-occurrence Culicoides network highlights seasonal compartments connected by vector species: weekly co-occurrence circular network maps and species roles. (A) Circular network: species are arranged in the two modules nesting seasons occurrence (Figure S1.4; summer–fall: orange; winter–spring: blue). Co-occurrence interactions between modules are drawn by a stronger opaque links pattern (violet) than within module interactions (transparent violet). Label size is relative to species degree (Table S1.4); vectors are red printed and plotted with circleplot [108]. (B) Species roles in the co-occurrence network sustaining and connecting modular configuration are shown in dimensions defined by z (within-module degree) and c (among-module connectivity) scores (Table S1.4). Dot colors follow modules in A, but only vector species are labeled. Dashed lines: threshold value for z (horizontal line: 1.39) and for c (vertical line: 0.6).

