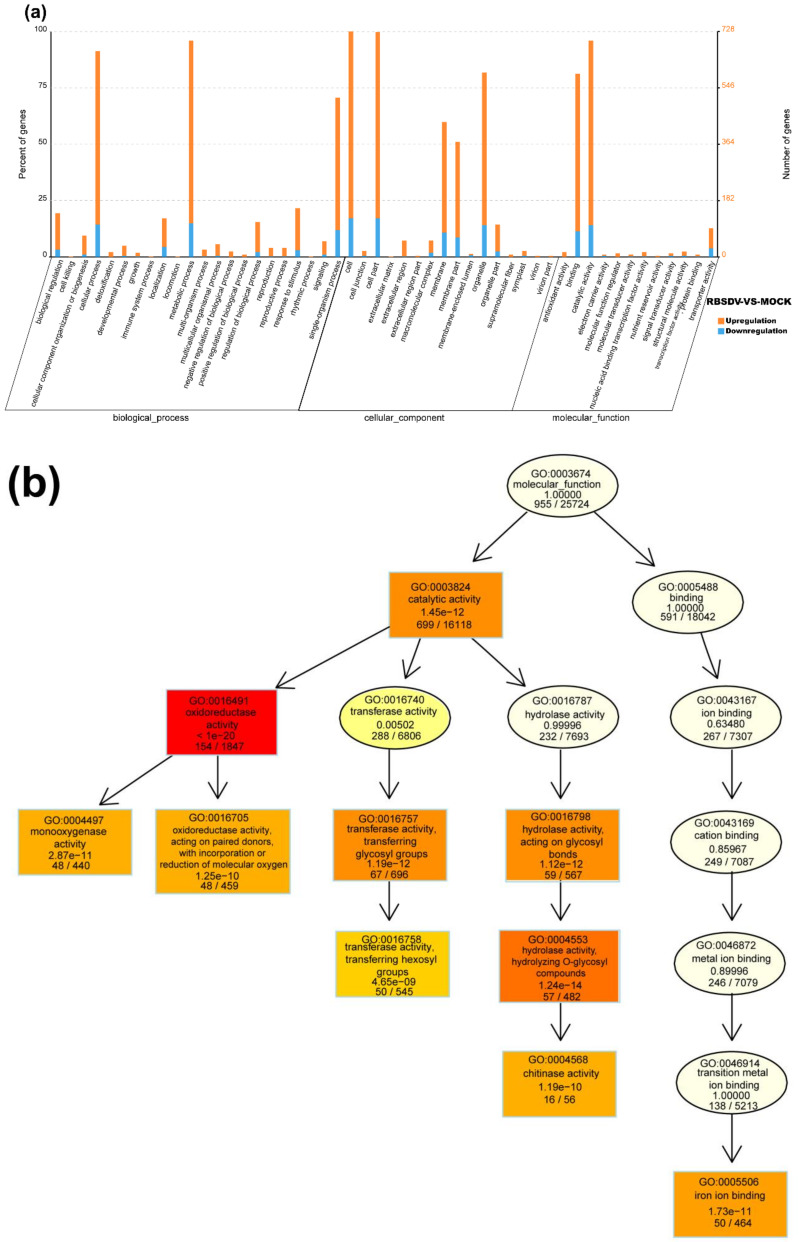
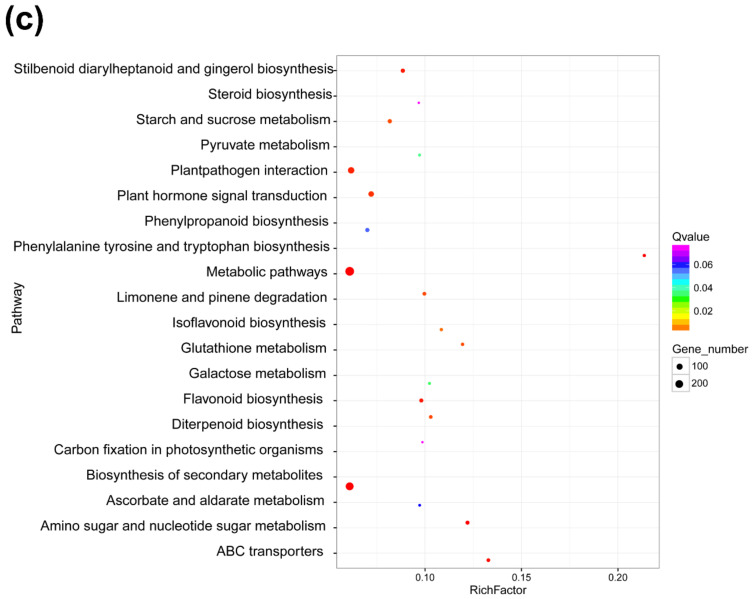
Figure 3.
Gene ontology (GO) function enrichment analysis, GO terms, and KEGG pathway enrichment of DEmRNAs identified in RBSDV-infected rice plants. (a) GO enrichment analysis of DEmRNAs with a p-value < 0.05; (b) gene ontology terms for molecular function of DEmRNAs; (c) statistics of the top 20 KEGG pathways enriched for DEmRNAs. The size of each circle represents the number of significant DEmRNAs enriched in the corresponding pathway. The enrichment factor was calculated using the number of enriched DEmRNAs divided by the total number of background genes in the corresponding pathway. A pathway with a p-value < 0.05 is considered to be significantly over-represented.


