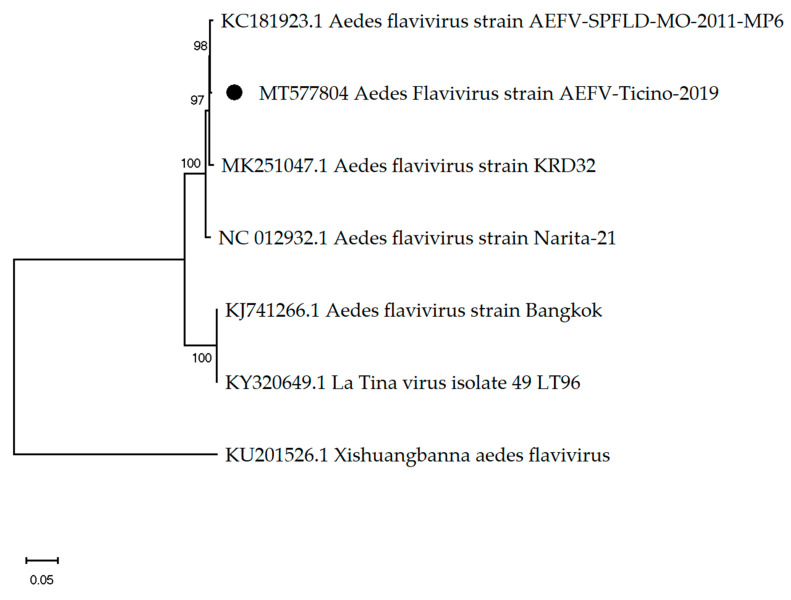
Figure 2.
The phylogenetic tree of Aedes flaviviruses constructed using the maximum likelihood method and Kimura 2-parameter model. The percentage of replicate trees in which the associated taxa clustered together in the bootstrap test (1000 replicates) are shown next to the branches. The black dot indicates the genome sequenced in this study.

