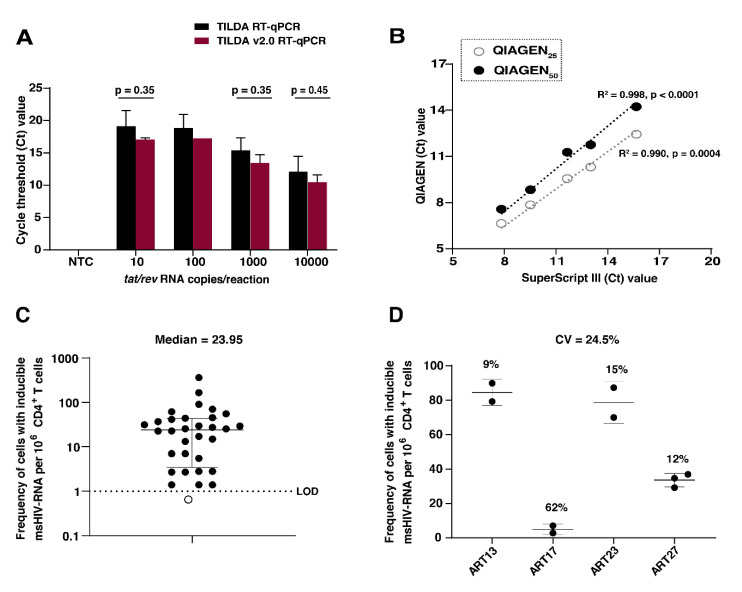
Figure 1.
TILDA analytical and clinical sensitivity. (A) Detection of serial dilutions of a synthetic tat/rev RNA template in the absence of cells using the original TILDA RT-qPCR conditions compared to the TILDA v2.0 RT-qPCR conditions. Three wells per dilution were tested based on cycle threshold (Ct) values. NTC = Negative template control. A multiple paired t-test was used to compare mean Ct values. The error bars represent the SD of the mean of two independent runs. (B) Dilutions of 10–10,000 copies of tat/rev RNA were pre-amplified using different reaction volumes using QIAGEN (25 µL; open circles, and 50 µL; closed circles) or Superscript III Platinum one-step RT kits. Three wells per dilution were tested for positivity. A Pearson’s correlation test between the reference and two test kits is shown. Statistical significance is determined by p < 0.05. (C) Quantification of inducible HIV-1 reservoirs in clinical samples. Frequency of CD4+ T cells expressing tat/rev msRNA after in vitro stimulation with PMA/Ionomycin (N = 32 HIV-1-infected individuals on suppressive cART). Target was not detected for one sample, indicated using an open circle. The median and interquartile range is shown (the median frequency of cells with inducible tat/rev msRNA per million CD4+ T cells = 23.95). The dotted line represents the assay limit of detection (LOD). (D) The inter-assay coefficient of variation (CV) determined from TILDA measurements of four individuals. Mean CV= 24.5%. The other numbers represent the CV for each individual calculated from a minimum of two independent measurements. The error bars represent SD of the mean.

