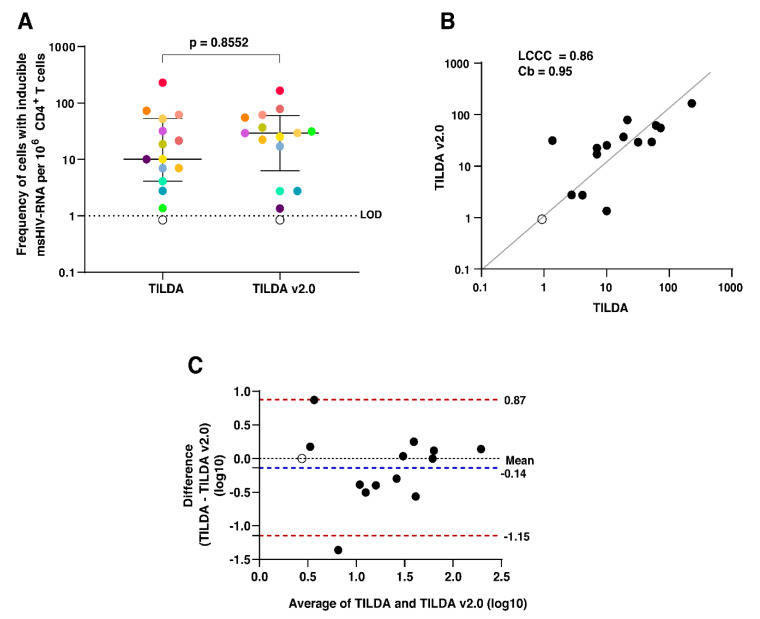
Figure 2.
TILDA inter-laboratory reproducibility. (A) The frequency of CD4+ T cells expressing tat/rev msRNA after in vitro stimulation with PMA/Ionomycin in a subset of individuals (N = 15), quantified by TILDA and TILDA v2.0. Each individual is represented by a different colored dot. The open circles are below the LOD. Wilcoxon’s matched-pairs test was used to compare the medians. Statistical significance is determined by p < 0.05. (B) Lin’s Concordance Correlation Coefficient (LCCC) plot. The black dots represent inducible reservoir size quantified by TILDA and TILDA v2.0. The open circle is below the LOD. The grey diagonal line represents the best-fit line. Coefficient of bias (Cb) is a measure of accuracy. (C) Bland–Altman plot using log-transformed inducible reservoir size measurements by the two assays. The open circle is below the LOD. The blue dotted line represents the mean bias, and the red dotted lines represent the 95% limits of agreement.

