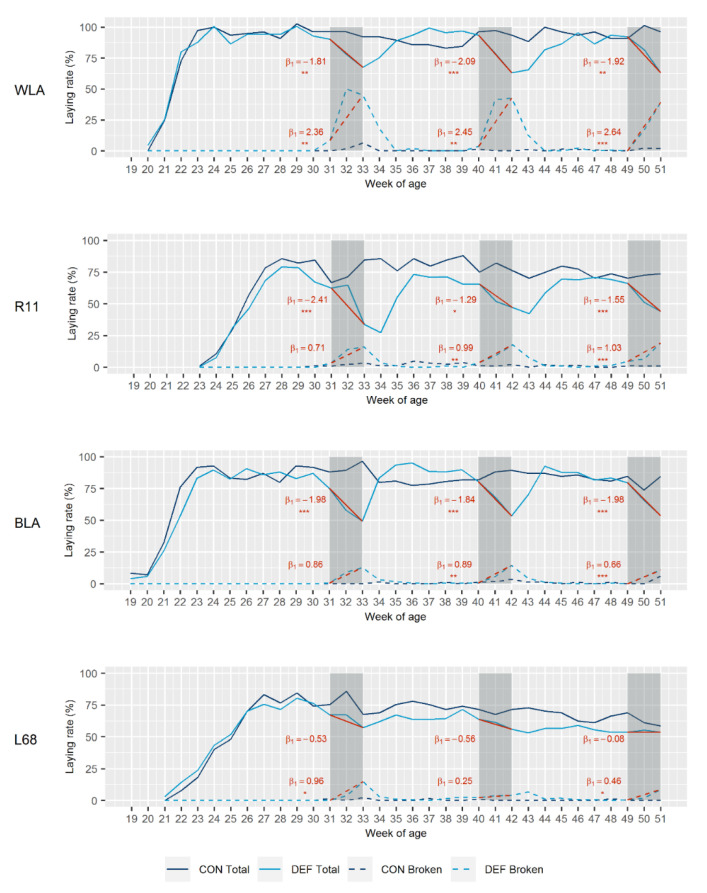
Figure 2.
Total laying rate (solid lines) and laying rate of broken eggs (dashed lines) in control (CON) and calcium (Ca) deficient (DEF) groups of four layer lines (white-egg layers (WLA, R11), brown-egg layers (BLA, L68)). Grey-shaded sections represent the periods of Ca depletion. Linear regression curves and the corresponding coefficients (β1) between day of depletion and total laying rate or laying rate of broken eggs are given in red. Significant regression coefficients are marked with asterisks (* p < 0.05; ** p < 0.01; *** p < 0.001). DEF groups: n = 22; CON groups: n = 11.

