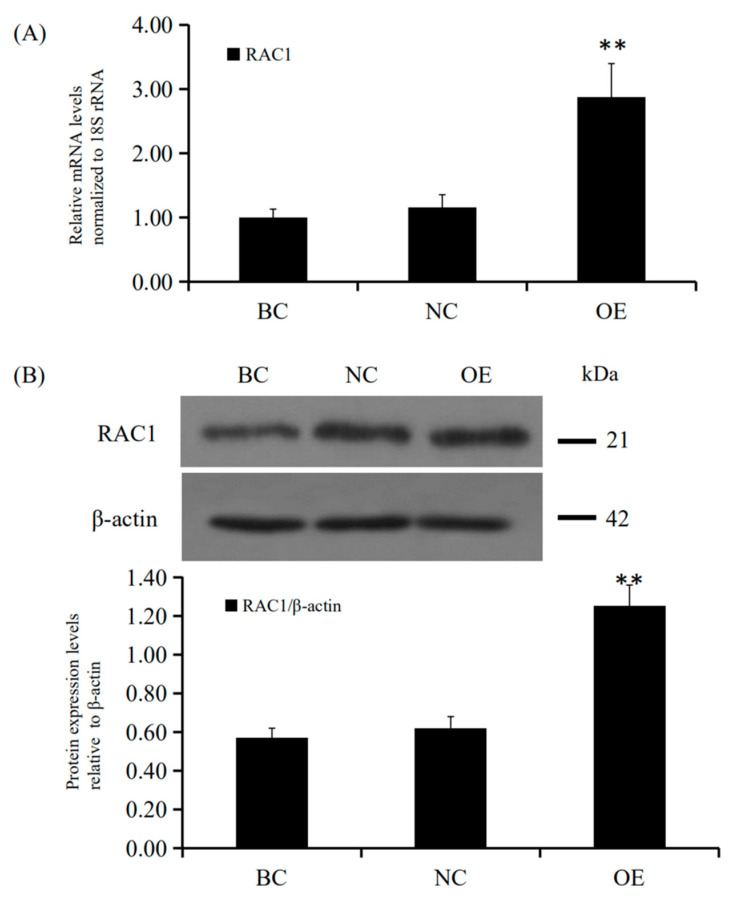
Figure 5.
Effects of RAC1 overexpression on GC RAC1 mRNA and protein expression. Different treatment groups were transfected into GCs from the prehierarchical follicles. OE group: pYr-adshuttle-4-RAC1 vector; NC group: pYr-adshuttle-4 empty vector; BC group: absence of expression vector. (A) RAC1 mRNA expression was scrutinized by RT-qPCR analysis with 18S rRNA as a normalization gene. (B) RAC1 protein expression was detected by western blotting analysis against β-actin protein. Data represent means ± SEM (n = 10). Bars with superscripts suggest the statistically noteworthy difference in comparison to the control groups (** p ˂ 0.01).

