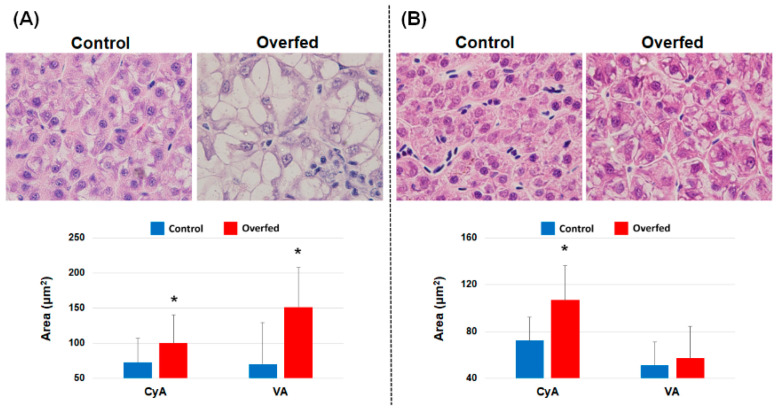
Figure 2.
Liver histology results. Panels (A,B) represent samples taken at weeks 2 and 8, respectively. The bar plots indicate the cytoplasmic area (CyA) and vacuolated area (VA) in the hepatocytes. The results are presented as the mean ± S.D. * indicates a significant difference (p < 0.05 based on student’s t-test).

