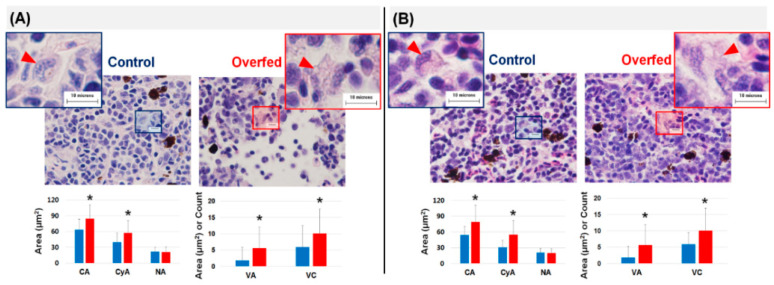
Figure 3.
The morphological characteristics of macrophages in head kidney based on histological results. The red triangles indicate macrophages. The leukocytes in overfed trout contained much larger cytoplasmic fat vacuoles with ambiguous boundaries between the cytoplasm and extracellular space. Panels (A,B) show samples taken at weeks 2 and 8, respectively. The total cell area (CA), cytoplasmic area (CyA), nuclear area (NA), vacuolation area (VA), and vacuole count (VC) in the macrophages are presented in bar plots. The blue and red bars indicate fish in the control and overfed groups, respectively. The results are presented as mean ± S.D. * indicates a significant difference (p < 0.05 based on student’s t-test).

