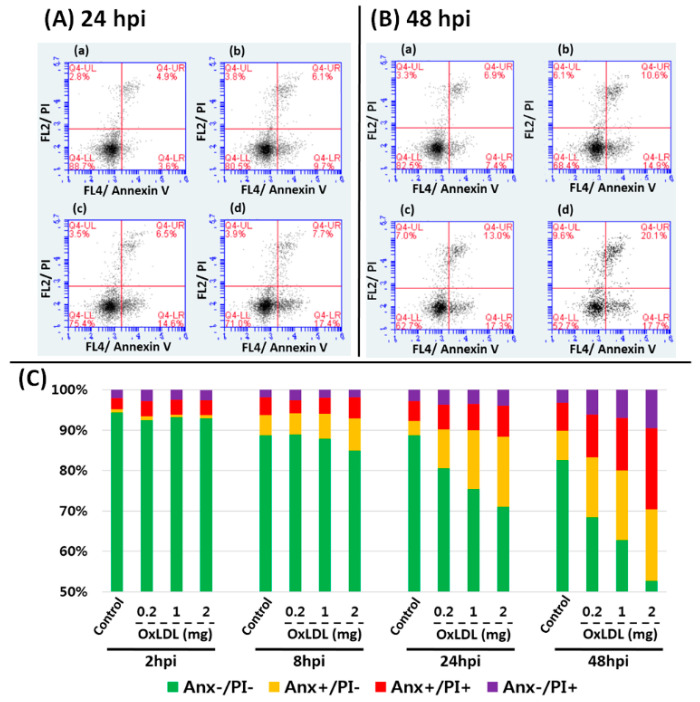
Figure 6.
The scattergrams of FL-2 (PI) plotted against FL-4 (Anx V) fluorescence of the leukocytes under (A(a)) and (B(a)) 0 (control); (A(b)) and (B(b)) 0.2; (A(c)) and (B(c)) 1, and (A(d)) and (B(d)) 2 mg/mL OxLDL treatment at 24 and 48 hpi, respectively. (C) The percentage of Anx V−/PI−, Anx V+/PI−, Anx V+/PI+, and Anx V−/PI+, at 2, 8, 24, and 48 hpi are indicated in the cumulative bar graph.

