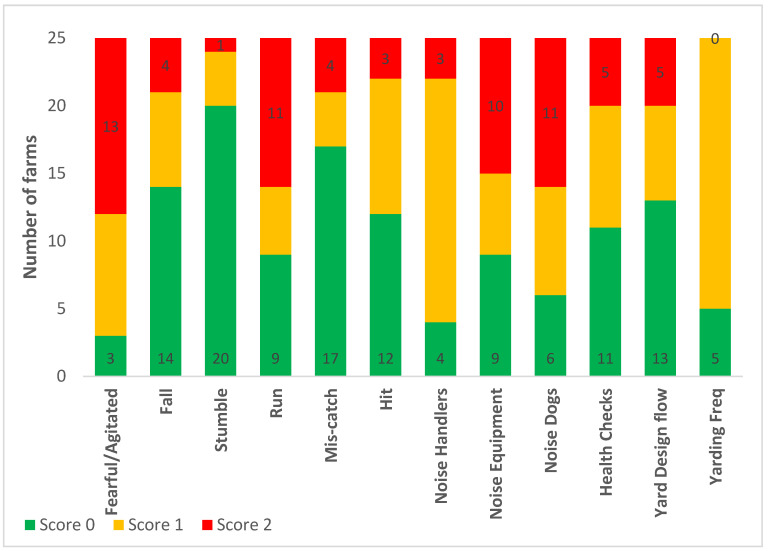
Figure 3.
Frequency analysis of categorised appropriate stockpersonship measures on the 25 Waikato beef farms, for which scores were assigned as either 0: good, 1: marginal, or 2: poor welfare. See Table 2 for further information on how each measure was categorised into a score of 0, 1 or 2.

