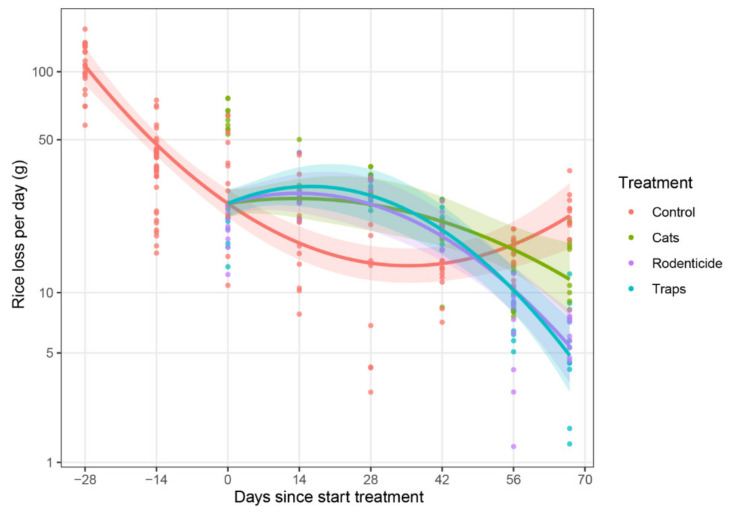
Figure 6.
Rice loss by rodents per day from baskets of rice in farmer stores during the wet season of 2016. Estimated time trend lines for each treatment were generated by a mixed model (see Section 2.6), with shaded areas representing 95% confidence bands, indicating that treatments had an effect on reducing rodent losses compared to the untreated control by the end of the storage period.

