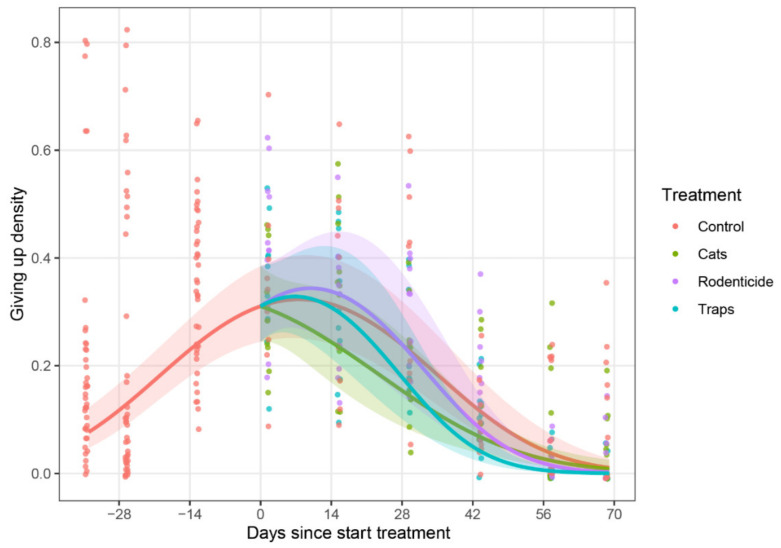
Figure 10.
Percentage of peanuts eaten by rodents per day (averaged over two consecutive observation days) in a giving up density monitoring trial in the wet season of 2016. Estimated time trend lines for each treatment were generated by a generalised linear mixed model (described elsewhere) with shaded areas representing 95% confidence bands for the predicted mean response. By the end of the storage period, the number of peanuts eaten from the GUD in the trapping and rodenticide treatments was marginally lower than the number eaten in the untreated control GUD.

