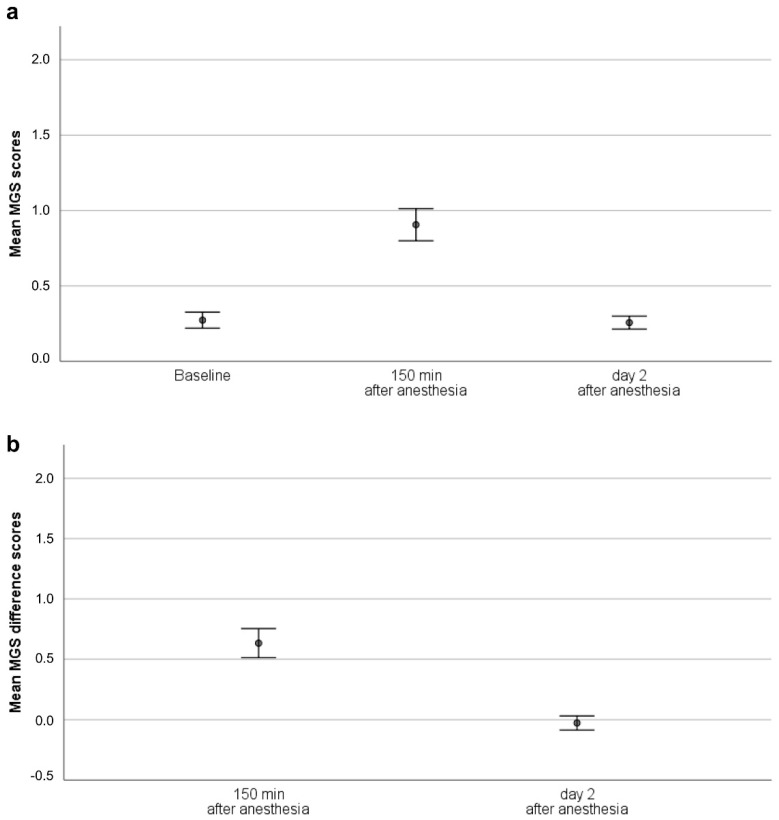
Figure 1.
MGS scores (mean, 95% confidence interval). (a) Mean MGS scores, (b) Mean MGS difference scores. Please note that data were derived from animals that received either no, one, or six anesthesia. Since the present study focuses on MGS reliability, treatment groups are not differentiated. The effects of the anesthesia regimes on the well-being of mice in the different treatment groups was investigated in a previous study by Hohlbaum et al. [17]. Abbreviation: Mouse Grimace Scale (MGS).

