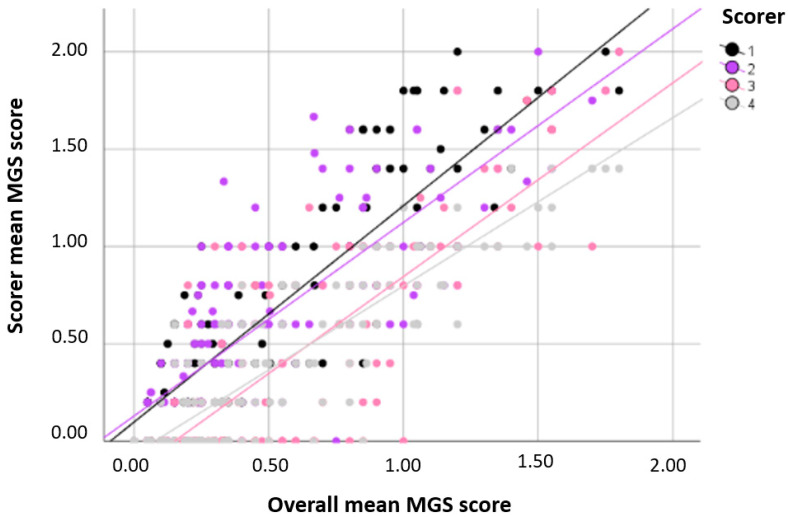
Figure 2.
Reliability analysis of the mean MGS scores. The mean MGS scores of each of the four scorers were compared to the mean MGS scores of all scorers. Three scores for each mouse were included in the analysis (i.e., one score each was obtained from images generated at baseline, 150 min, and two days after anesthesia). Abbreviation: Mouse Grimace Scale (MGS).

