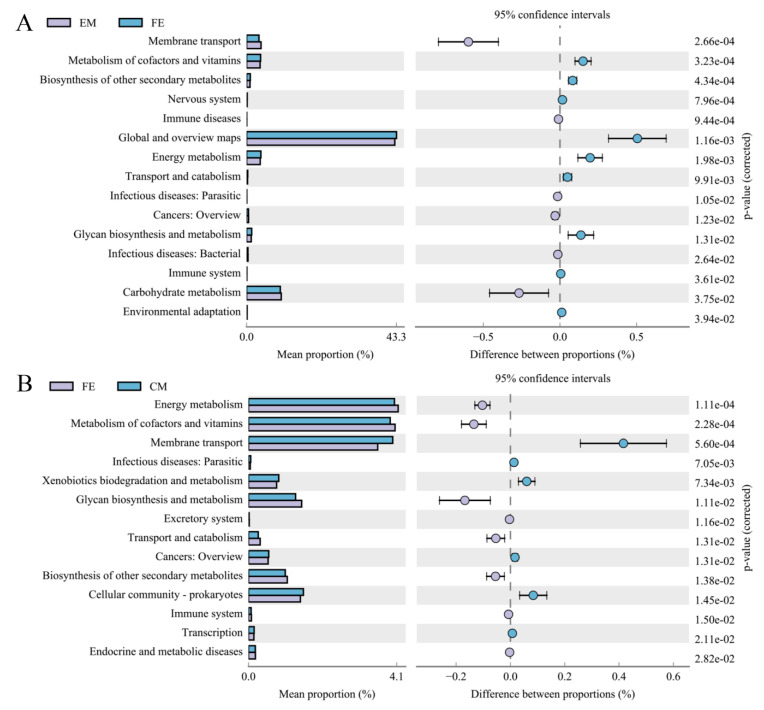
Figure 5.
Analysis of the difference of KEGG metabolic pathway between groups at the second level. (A) comparison between entire male pigs and female pigs; (B) comparison between female pigs and castrated male pigs. Different colors represent different groups. The left figure in the picture shows the abundance ratio of different functions in two groups of samples, the middle shows the difference ratio of functional abundance in the 95% confidence interval, and the right value is the p-value.

