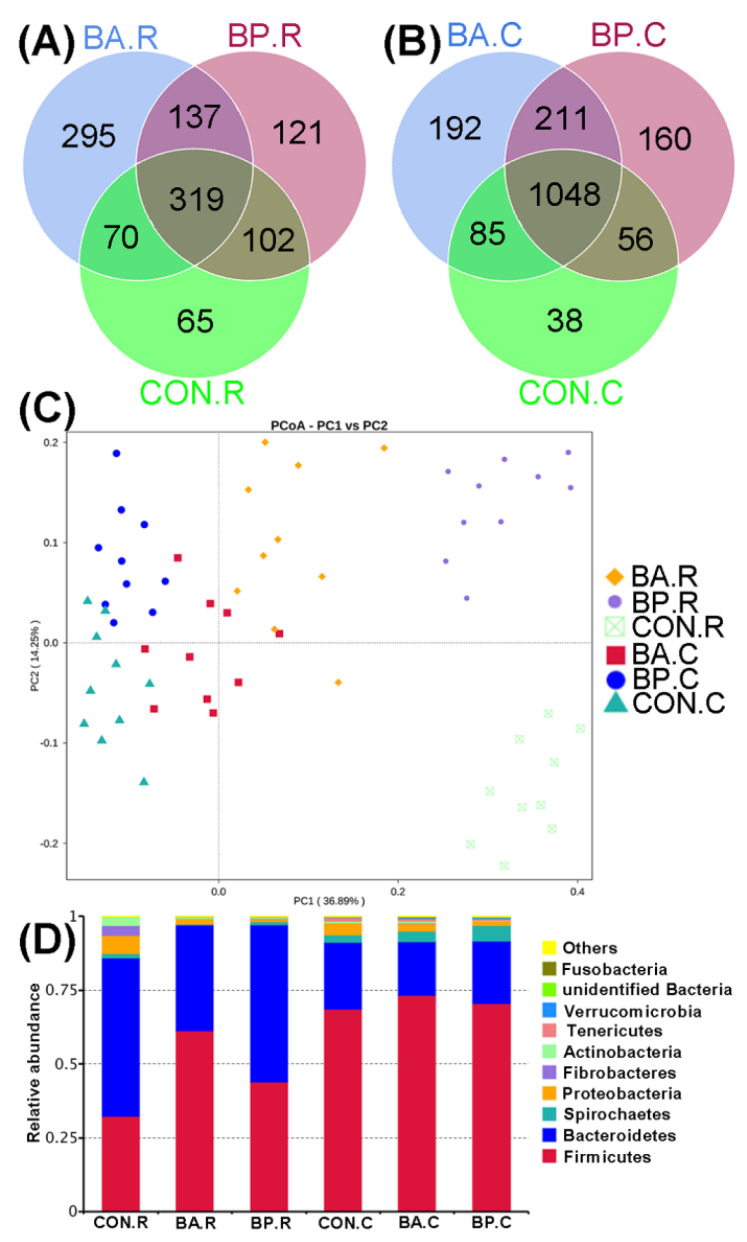
Figure 3.
Venn and Principal Coordinates Analysis for microbial composition. (A,B) Venn diagrams for bacterial OTUs (Operational Taxonomic Units), (C) Principal coordinate analysis in terms of unweighted UniFrac metrics, and (D) Composition of microbial communities calculated at the phylum level. BA.R, BP.R, and CON.R indicate rumen content samples of BA-treated, BP-treated, and control groups, respectively; BA.C, BP.C, and CON.C indicate caecum feces samples of BA-treated, BP-treated, and control groups, respectively.

