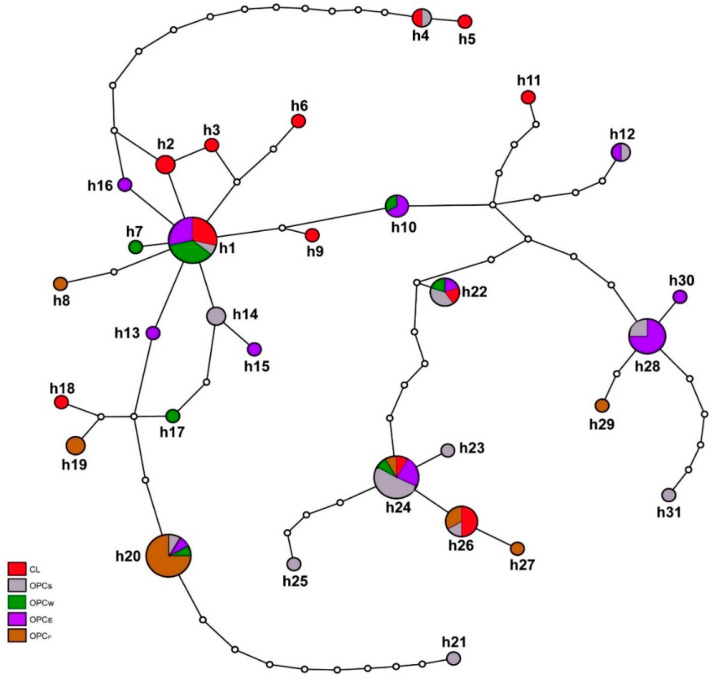
Figure 3.
Pattern of 31 mtDNA control region haplotypes in Colombian Creole sheep constructed using the TCS program and plotted with tcsBU. Each haplotype is represented by a pie chart with size proportional to the number of sequences of each breed. The number of haplotypes corresponds to those indicated in Table 2 and Table S4. The small white circles indicate mutational changes. The five Creole breeds are indicated by the colors shown in the legend. CL—wool Creole; OPCE—Ethiopian; OPCS—Sudan; OPCP—Pelibuey; OPCW—Wayúu.

