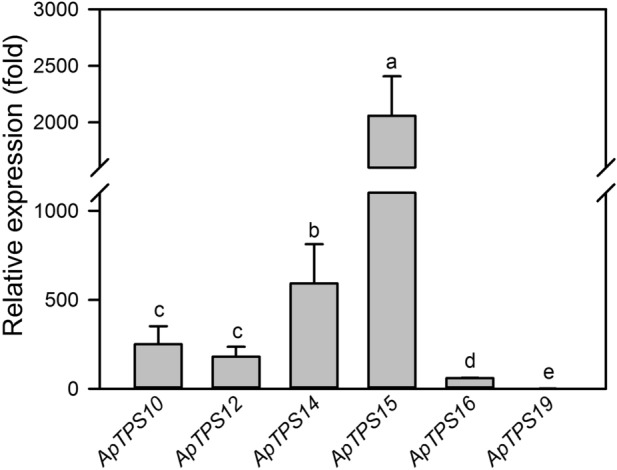
Figure 3.

Relative transcription levels of the six nerolidol synthase genes in the plant of A. philoxeroides under undamaged control conditions. UBC was used as the reference gene to calculate the gene transcript level. The relative expression level of each NES is shown in fold relative to that of ApTPS19 which had the lowest transcription level that was taken as “1”. The values are means ± SD of three biological replications. Different letters indicate statistical differences between the genes, revealed using a one-way ANOVA and a Tukey’s post-hoc test (P < 0.05).
