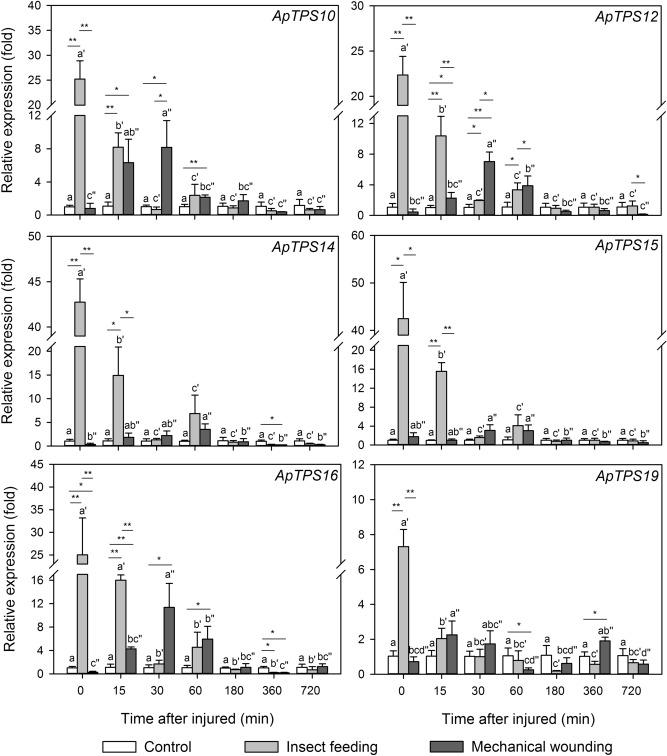
Figure 5.
Nerolidol synthase gene expression levels in the control group, A. hygrophila feeding group, mechanical wounding group of A. philoxeroides plants. In the A. hygrophila feeding group, the A. philoxeroides leaves were sampled at the indicated time points following a 1-h feeding experiment. In the mechanical wounding group, the A. philoxeroides leaves were sampled at the indicated time points following their mechanical damage. The values are means ± SD (normalized that the expression level in the control group equal to 1) of three biological replications. Different letters indicate statistical differences between different time treatments in control group, as determined using a one-way ANOVA and a Tukey’s post-hoc test (P < 0.05). Different letters with single quotation mark indicated statistical differences between different time treatments after insect feeding, as determined using a one-way ANOVA and a Tukey’s post-hoc test (P < 0.05). Different letters with double quotation marks indicate statistical differences between different time treatments after mechanical wounding, as determined using a one-way ANOVA and a Tukey’s post-hoc test (P < 0.05). Asterisks indicate statistical differences between every two treatments in the same time treatment (*P < 0.05; **P < 0.01; Student’s t-test).

