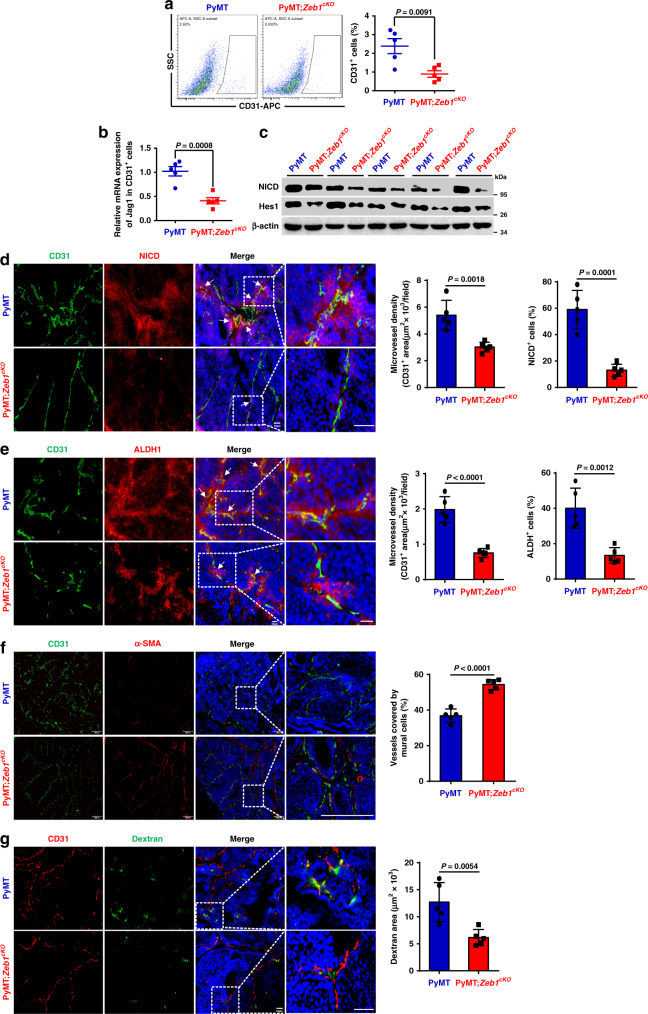
Fig. 6. Depletion of Zeb1 subverts the tumor vascular niche.
a Flow cytometry analysis of the CD31+ endothelial cell fraction (n = 5 PyMT, 5 PyMT;Zeb1cKO). b Relative mRNA levels of Jag1 in CD31+ endothelial cells (n = 5 PyMT, 5 PyMT;Zeb1cKO). c Protein levels of NICD and Hes1 in EpCAM+ tumor cells (n = 5 PyMT, 5 PyMT;Zeb1cKO). d Immunofluorescence staining for NICD and CD31 in breast cancer tissue (n = 5 PyMT, 5 PyMT;Zeb1cKO). The highlighted regions in the left panels are enlarged in the right panels. Scale bars, 50 μm. e Immunofluorescence staining for ALDH1 and CD31 in breast cancer tissue (n = 5 PyMT, 5 PyMT;Zeb1cKO). Scale bars, 20 μm. f Immunofluorescence staining for CD31 and α-SMA in breast cancer tissue (n = 5 PyMT, 5 PyMT;Zeb1cKO). Vessel normalization was determined with the CD31/α-SMA ratio. Scale bars, 200 μm. g Dextran leakage assay and immunofluorescence staining for CD31 in breast cancer tissue (n = 5 PyMT, 5 PyMT;Zeb1cKO). Scale bars, 50 μm. Indicated P-values were calculated using two-tailed unpaired Student’s t-test. Data are presented as mean ± SEM in a, b, d–g. Dots depict individual samples in a, b, d–g. Data are representative of five (a–g) independent experiments. Source data are provided as a Source Data file.

