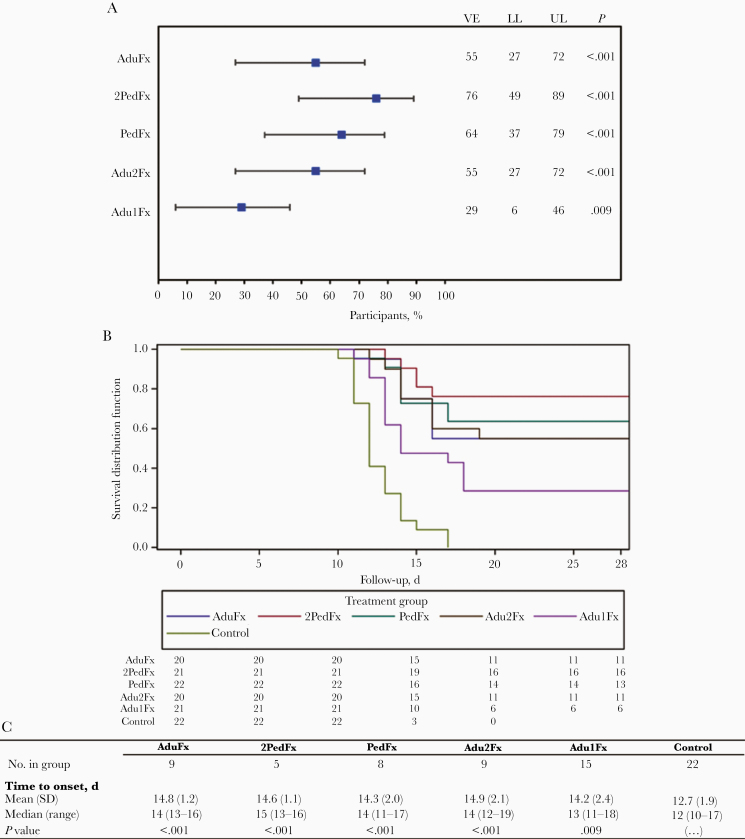
Figure 2.
Vaccine efficacy (VE) and occurrence of parasitemia. A, VE in the prevention of confirmed Plasmodium falciparum parasitemia for all 5 study groups. Error bars indicate 95% confidence intervals (CIs). B, Kaplan-Meier survival curve for the time to onset of confirmed P. falciparum parasitemia. C, Mean times to onset of confirmed P. falciparum parasitemia in all study groups. P values represent comparison with the infectivity control group. Abbreviations: LL, lower limit of the 95% CI; UL, upper limit of the 95% CI.

