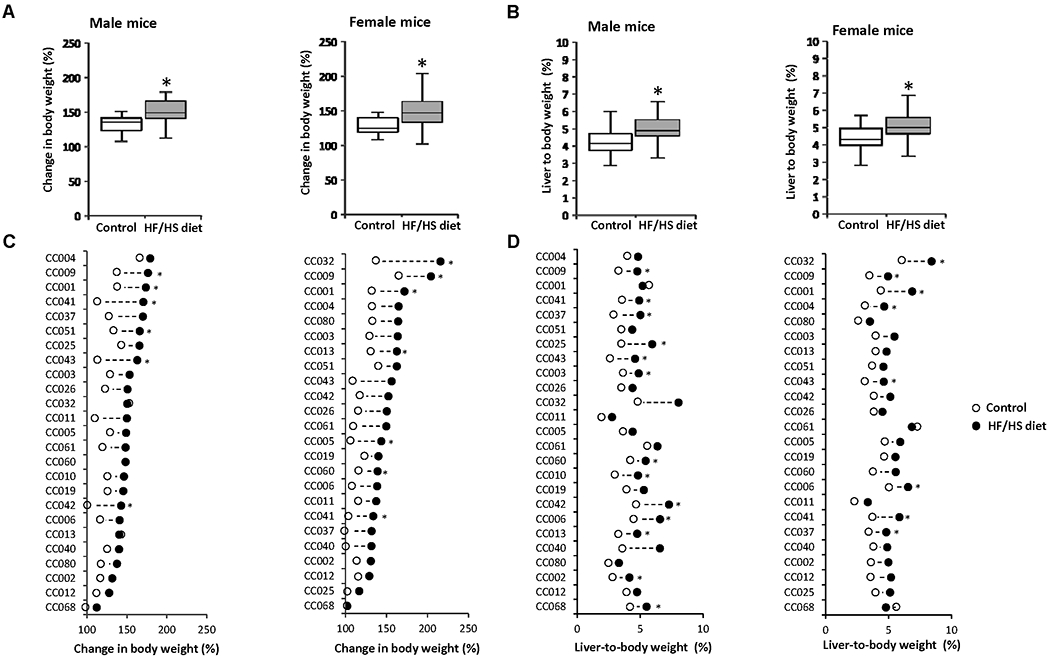
Figure 1. Body weight and liver-to-body weight ratio in Collaborative Cross (CC) mice fed a high-fat and high-sucrose diet or a control diet.

(A) Population averages for body weight and (B) liver-to-body weight ratios in male and female mice fed a control diet or HF/HS diet. (C) Average change in body weight and (D) liver-to-body weight ratios in HF/HS diet-fed mice (black dot) as compared to control diet-fed mice (white dot) in the individual mouse strains. Asterisks * denote significant difference (p < 0.05).
