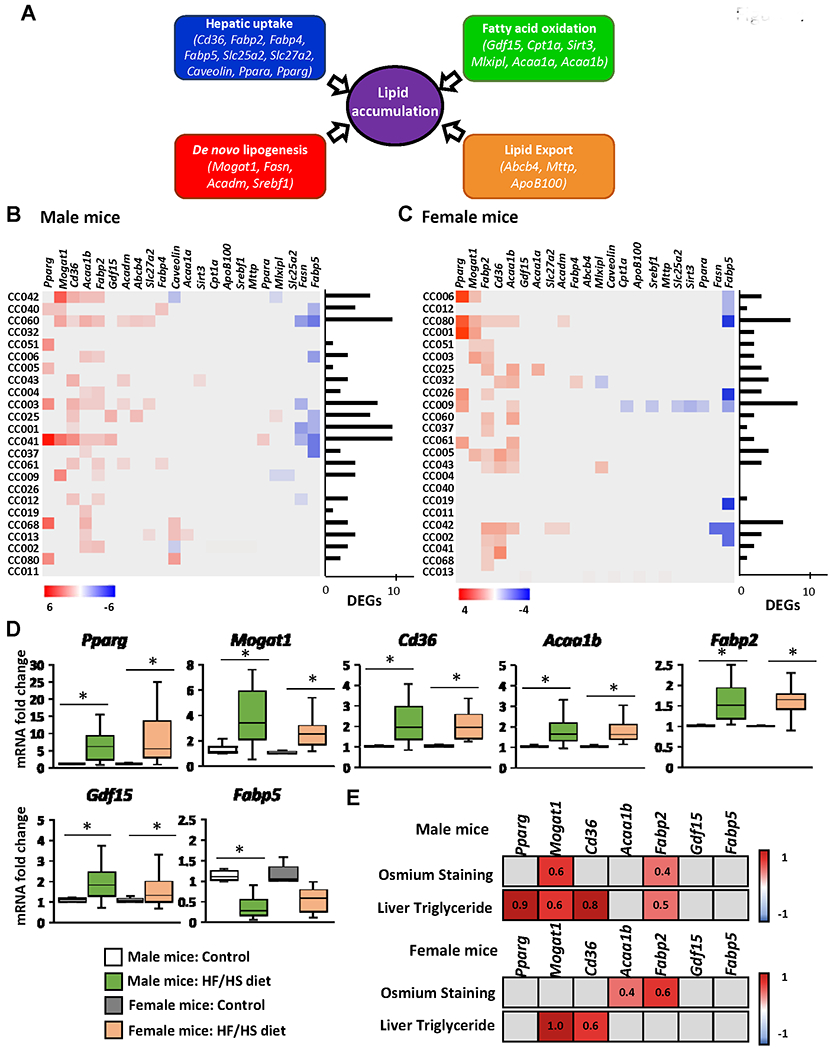
Figure 4. Expression of lipid metabolism genes in the livers of Collaborative Cross mice fed high-fat and high-sucrose or control diet.

(A) Schematic of hepatic lipid metabolism pathways and genes selected for qRT-PCR gene expression analysis. Heat map fold change in the expression of lipid accumulation genes in individual mouse strains of male (B) and female (C) mice. Gene expression was measured by qRT-PCR and the relative amount of each mRNA transcript was determined using the 2−ΔΔCt method. Significant differentially expressed genes in the livers of mice fed a HF/HS diet compared to a control diet were identified by Student’s t-test (p < 0.05 considered significant). Red color denotes > 1.5-fold increase in gene expression in the livers of HF/HS diet-fed mice; blue color denotes > 0.67 decrease in gene expression in the livers of HF/HS diet-fed mice. Grey boxes denote non-significant change in gene expression. (D) Averages of genes significantly altered (p < 0.05) at the population level in the livers of male and female mice fed a HF/HS diet compared to mice fed control diet. (E) Heat map of Pearson correlation coefficients (r) of genes with population wide significant changes in gene expression of male and female mice fed a HF/HS diet in relation to osmium staining and liver triglyceride levels. p<0.05 was considered a significant correlation. Red color denotes positive correlation, blue color denotes negative correlation, grey boxes statistically not significant. Pearson r values are indicated.
