Fig. 1.
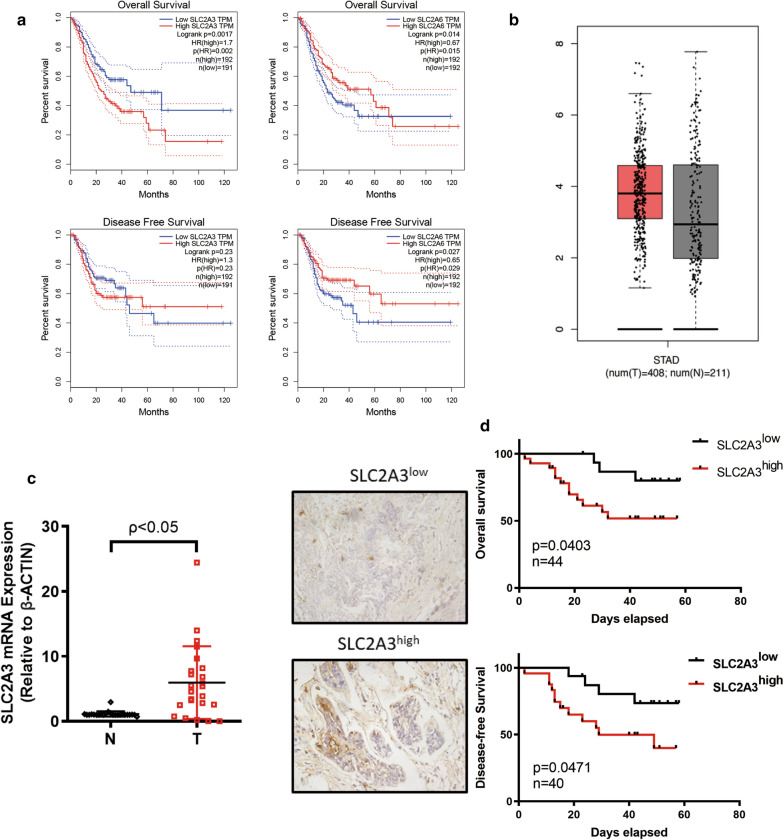
SLC2A3 overexpression correlated with poor prognosis in gastric cancer (GC). a Overall survival (OS) curves (n (high) = 192, n (low) = 191) and disease-free survival (DFS) survival curves for patients with GC by SLC2A3 expression (n (high) = 192, n (low) = 191). OS survival curves (n (high) = 192, n (low) = 192) and DFS survival curves for patients with GC by SLC2A6 expression (n (high) = 192, n (low) = 192). b SLC2A3 mRNA expression in stomach adenocarcinoma (GEPIA database). c SLC2A3 mRNA expression in GC tissue and paired normal gastric mucosa as determined by RT-PCR. d SLC2A3 IHC staining in GC samples (representative images), OS survival curve (n = 44), and DFS survival curve of SLC2A3 high and low groups in GC (n = 40)

