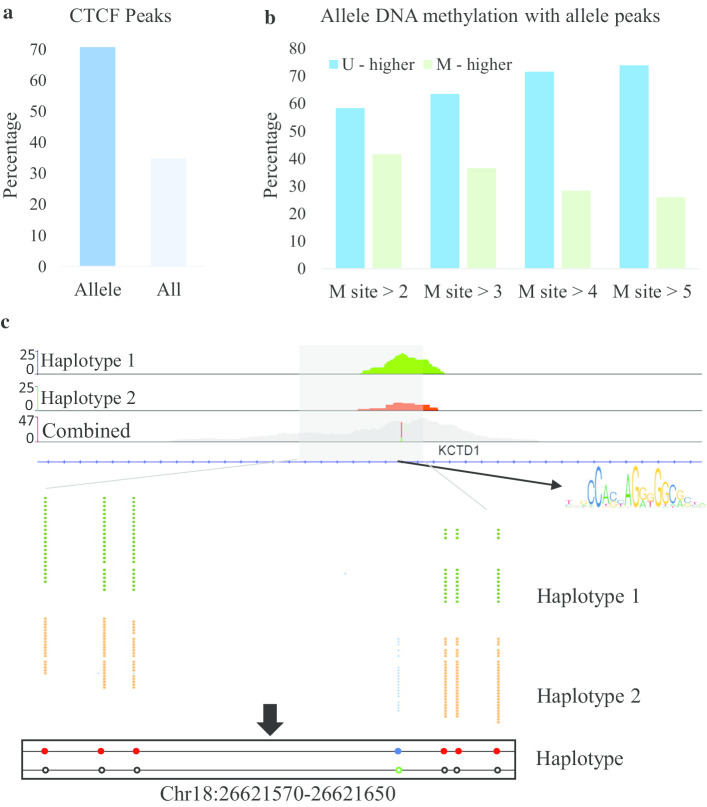
Fig. 5.
The association between ASM and allele-specific CTCF peaks (ASCPs). a The distribution of ASM on the ASCPs. The left and right bars indicate the proportions of ASM in ASCPs and all CTCF peaks, respectively. Fisher's exact test was used in significance analysis. b The relationship between ASM and ASCPs. U-higher and M-higher means higher CTCF haplotypes were unmethylated and methylated, respectively. The M site indicates the number of adjacent methylation sites in the ASM region. c An example of ASCPs in the region chr18:26, 621, 440-26, 621, 650. The figure shows all bisulfite reads and the haplotype results in this region

