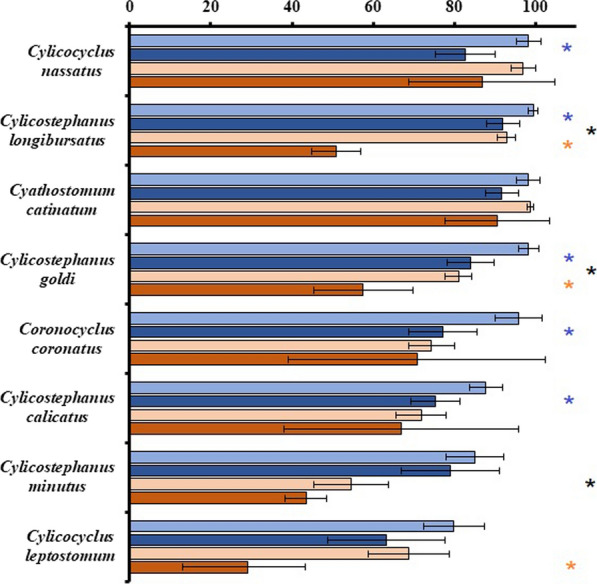
Fig. 5.

Species by region by collection method (‘Species*Region*Method’) pairwise comparisons of grand mean prevalence (%) for North America*Critical Test (light blue), North America*Standard Necropsy (dark blue), Eastern Europe*Diagnostic Deworming (light orange), and Eastern Europe*Standard Necropsy (dark orange). Data presented as least squares means estimates with 95% confidence intervals for the top eight most prevalent cyathostomin species. Asterisks denote significant differences (P < 0.05) in species prevalence: blue between North American methods, orange between eastern European methods, and black between North American and eastern European standard necropsies
