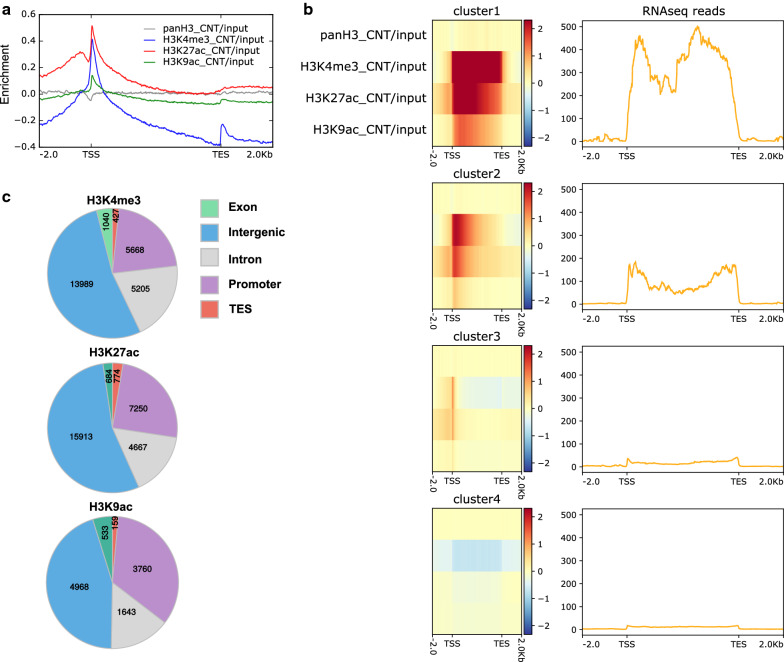
Fig. 1.
Global histone modifications across gene bodies in Hydra. a Average profile of the occupancy of the histone H3 and histone modifications H3K4me3, H3K27ac and H3K9ac on genomic regions containing gene bodies (2 Kb upstream and downstream of the transcription start site (TSS) and transcription end site (TES) respectively). b Heatmaps representing the four k-means clusters (left) and the average profile of the RNA-Seq reads for the clusters (right). c Global occupancy of the three histone modifications H3K4me3, H3K27ac and H3K9ac on different regions of the genome with the numbers representing the number of peaks for the respective histone marks (legend for the colors of the pie-chart is shown on the right)

