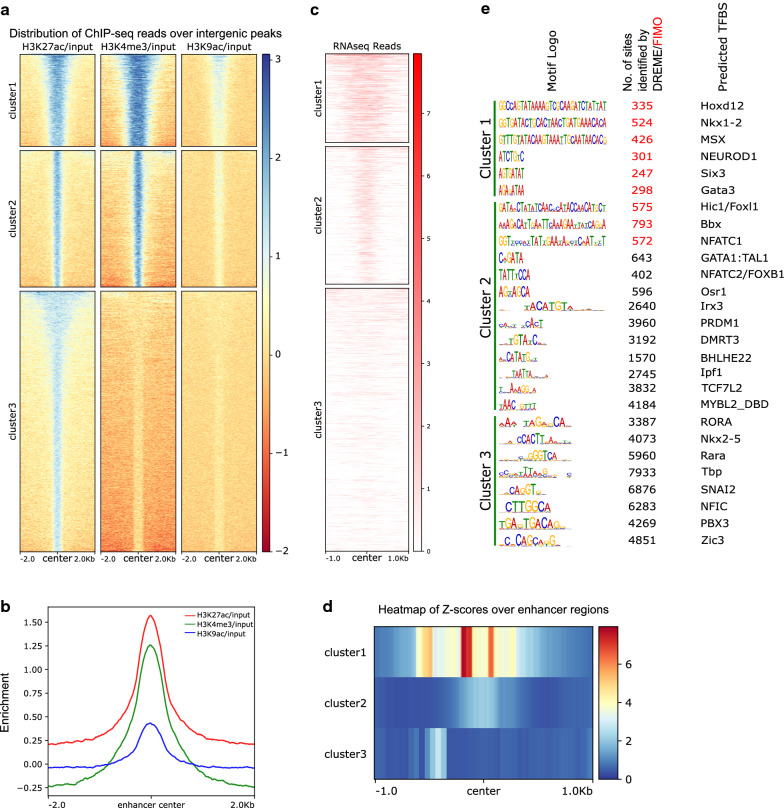
Fig. 2.
Enhancer identification and TF motif enrichment in the intergenic regions in Hydra genome. a Heatmap depicting the occupancy of the three histone modifications H3K27ac, H3K4me3 and H3K9ac on the intergenic H3K27ac peaks. Three k-means clusters were obtained based on combinatorial presence of the three modifications. b The average profile of the modifications around the center of the peak was plotted for all the intergenic regions. c The cluster wise expression of RNA depicted as heatmap based on RNA-Seq reads aligned to the corresponding intergenic regions depicted in ‘a’. d The Z-scores of the average RNA-seq read profiles for all three clusters over putative enhancer regions. e The transcription factor binding motifs/sites (TFBS) that exhibit central enrichment in the intergenic regions of each cluster. The logos of motifs for the TFBS are shown in the first column and the total number of sites identified by DREME (black font) or FIMO (red font) are shown in the second column. The third column shows the transcription factors identified by TOMTOM [35]

